While some segments are seeing softening, others face the hardest market conditions in decades. In this State of the Market report, Amwins specialists share market intelligence spanning rate, capacity, and coverage trends across lines of business and industries.
As we begin our journey into 2023, the insurance marketplace can be likened to a roller coaster – with twists and turns, upward momentum, and steep drops. On one hand, we’ve seen some strong underwriting results from carriers leading to softening in some market segments. On the other hand, we’re experiencing some of the hardest market conditions we’ve faced in decades for other segments. And that makes a report like this challenging to publish because it’s a snapshot of a marketplace where, for some segments, we could update it weekly, if not daily.
So, the most important message of this report isn’t a market prediction—it’s a promise to our clients. The promise that the specialists at Amwins remain focused on helping you deliver the best products the market can offer—no matter what the current state of the market might be. Through our deep industry knowledge, creative problem solving, access to exclusive products, and value-added tools and data, we are always ready to help you navigate the challenges and inevitable changes that lie ahead.
In this State of the Market report, specialists across all Amwins divisions dive into factors affecting market conditions and share intelligence spanning rate, capacity and coverage trends across numerous lines of business and industries in the U.S. as well as in London (European markets) and Bermuda.
Market Summaries

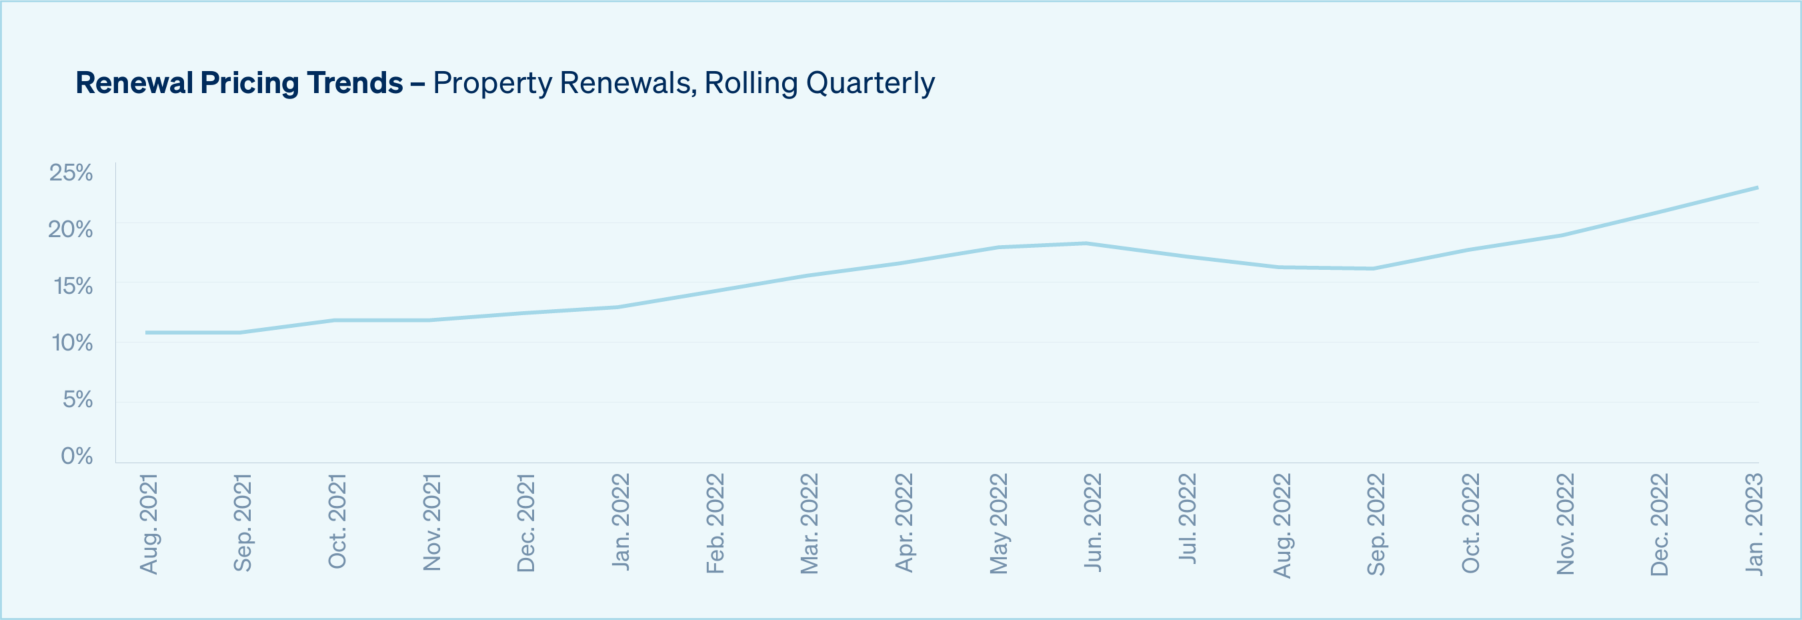
Property
In December we published a Q4
Property Market Update that explored all the factors shaping the trajectory of the E&S marketplace at that time. Unfortunately, nothing has changed for the better since.
While we are unlikely to know the true state of the 2023 market until after the March 1 renewal cycle, we expect the hard market to continue with no softening in the foreseeable future.
As you read through this report, you will find these themes running through the property segment of almost every industry:
- Catastrophic weather events—a major hurricane making U.S. landfall in five out of the last six years, wildfires engulfing thousands of acres, unprecedented winter storms, Midwest flooding, etc.—have played a major role in hardening the insurance marketplace.
- Accounts with a large probable maximum loss (PML) and average annual loss (AAL) will continue to be in the spotlight. Carriers will offer less capacity and higher deductibles in an effort to manage their portfolio aggregates as well as concentrate on profitability.
While individual states work to pass bills to provide relief, it seems unlikely that any will create meaningful change immediately.
- Carriers are seeking more geographic diversity (non-CAT exposures) in their books, which will marginally help to mitigate rate increases for those accounts.
- Global inflation and financial and economic uncertainty are causing an increase in the cost of capital, adding to rising rates. As rates and inflation increase, it becomes more and more important for the insured to revisit reported valuations and increase as necessary to account for true replacement cost and current rent price/business income.
Carriers say insurance to value (ITV) is off by 30% or more. The difference in valuation that markets feel is needed varies greatly by region and occupancy. Carriers will be addressing this with renewals, and accounts where values have remained unchanged and/or unsupported will see their rates increase dramatically or, in some cases, their submissions will fall to the bottom of the pile.
- Reinsurance treaty renewals for 1/1 were as difficult as predicted with capacity tightening across the board. Renewals were completed, however most saw increases in rate, retention, and net retentions throughout program structures as well as more restrictive terms and conditions. Most program structures now look completely different than they have in previous years. Learn more in the reinsurance section of this report.
London and Bermuda
London companies and Lloyds syndicates also experienced a very tough 1/1 reinsurance renewal and although the majority are showing an appetite to take advantage of the current hard market conditions, several syndicates are needing to shed some of their most significant critical catastrophe exposed accounts from their portfolios. Many carriers are looking to write more non-CAT exposed accounts into their portfolios, including manufacturing and light industrial, and continue to participate across all layers of programs.
In Bermuda, numerous carriers are reducing their line size for CAT exposed accounts. Some carriers are non-renewing and/or sparingly adding accounts that significantly contribute to their overall named windstorm (NWS) aggregate, especially those with Florida exposures. Rate increases are expected to be 30%+ and some markets are requesting a Values Limitation Clause. Despite all of this, the Bermuda market remains a significant source of buffer and excess capacity. We anticipate that underwriters will be inundated with submissions this year, therefore submission quality will be critical. For more technical risks, engineering reports will also be key.
Small Business
Small business markets continue focus on risk selection and balancing their portfolio with a mix of attritional and catastrophe exposures as well as GL. Expectations are that more business will be pushed into the middle market due to inflation and carriers restricting binding authorities to manage exposures.
Once carriers have implemented changes following 1/1 reinsurance renewals, they will likely open in Florida again – albeit cautiously and without loading up too heavily before wind season.
There is no doubt this market is challenging, but it should provide a more stable insurance environment for the long-term.
Select image to view larger
Insight provided by:
- Harry Tucker – EVP and Amwins’ National Property Practice Leader
- Jessica Zuiker – VP and Amwins’ Assistant National Property Practice Leader
- Toby Colls – Managing Director, Property with Amwins Global Risks
- Nicola Golder – SVP, Property with Amwins Access
- Kayla Bridgewater, Rukiya O'Connor, Makeda Goater, and Alan Waring – Amwins Bermuda

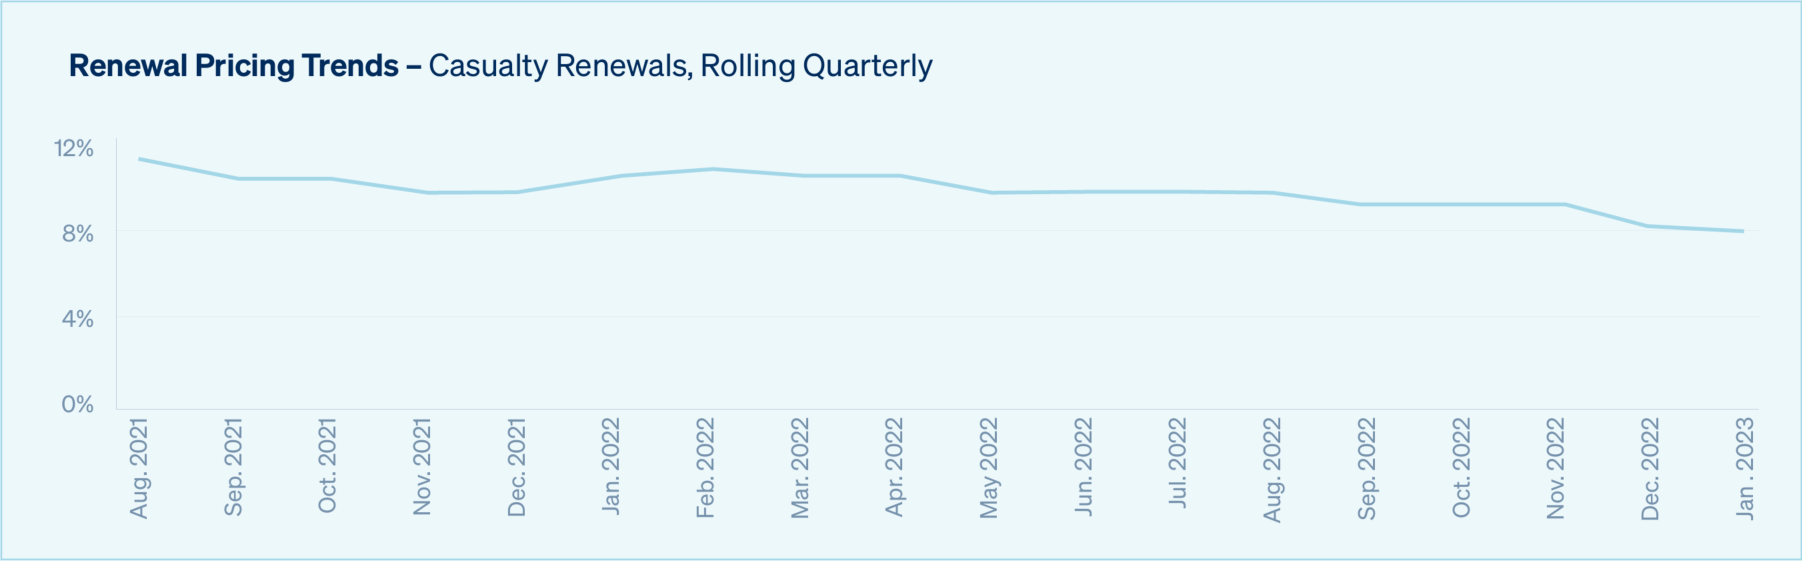
Casualty
Overall pricing in the casualty market remains on trend from our previous State of the Market report. In the primary space, renewals remain largely flat except for the usual challenged classes—heavy auto-exposed, habitational, trucking, healthcare, hospitality, and liquor liability to name a few.
Carriers continue to analyze and reevaluate their books in challenging classes and venues, and they are altering terms, adjusting rate, or exiting classes entirely. New carriers are not eager to move into these spaces, which results in less capacity at higher rates. Conversely, in less challenged classes and locations, more capacity has entered the market resulting in a more competitive rate environment.
That said, due to the dislocation in the property market, reinsurers are being extremely cautious with all their capacity, which may have an adverse effect on the casualty market as we move further into 2023. Capacity, rate, terms, and ceding commissions are all in play for the coming treaty renewals. We have yet to see the effect of the U.S. court system coming back to life after the pandemic-induced lull. The potential effect of recent nuclear verdicts, in addition to rises in medical inflation, suggest that the road ahead will not be smooth.
The excess space continues to be very active with moderate rate increases anywhere from flat to 15%, depending on account size, losses, and risk exposure. But not the dislocation we had 24 months ago. Carriers are hinting at expanding limit offerings in the excess and are more willing to look at lead layers below $10M where the rate on line is more favorable.
These dynamics have made renewals a bit easier to predict giving brokers the ability to better prepare their clients and insureds. This is in contrast to the past few years of major rate swings and capacity reductions.
Now that the market has settled somewhat, carriers are focusing on growth and want to add new business to their books. In London, the focus is on commercial construction, product manufacturers, and rail transportation. There is still significant capacity in the Bermuda market with new markets deploying attachments as low as $5M to $10M with attractive pricing, terms, and conditions. There has also been increased interest in alternative risk transfer solutions, such as captives and structured deals.
In the U.S., there is a huge interest from carriers to diversify their books by focusing on smaller, middle market accounts ranging from $10,000 to $75,000 in premium. Some carriers are launching business units to focus on this space and are building efficiencies in quoting and binding to take advantage of the more transactional nature of that marketplace.
In the small business sector, rate increases and term restrictions have slowed with the exception of hotel/motel and habitational as well as assault and battery and liquor liability coverage (in tougher states). Markets continue to refine eligibility criteria and terms they are willing to offer on targeted classes within their portfolio. As new binding authority entrants look to gain market share, they will entertain some distressed classes, but similar to liquor liability they will take a more conservative approach and not have a one size fits all approach as we saw prior to the hard market.
This report will take a look at how casualty markets are behaving in specific industry segments.
Select image to view larger
Insight provided by:
- Tom Dillon – EVP and Amwins’ National Casualty Practice Leader
- Nate Schepers – AVP and Amwins’ Assistant National Casualty Practice Leader
- Kelly Carney – SVP and Casualty Practice Leader with Amwins Access
- Tom Graham – Director and Head of Casualty with Amwins Global Risks
- Alan Mooney – CEO of Amwins Bermuda

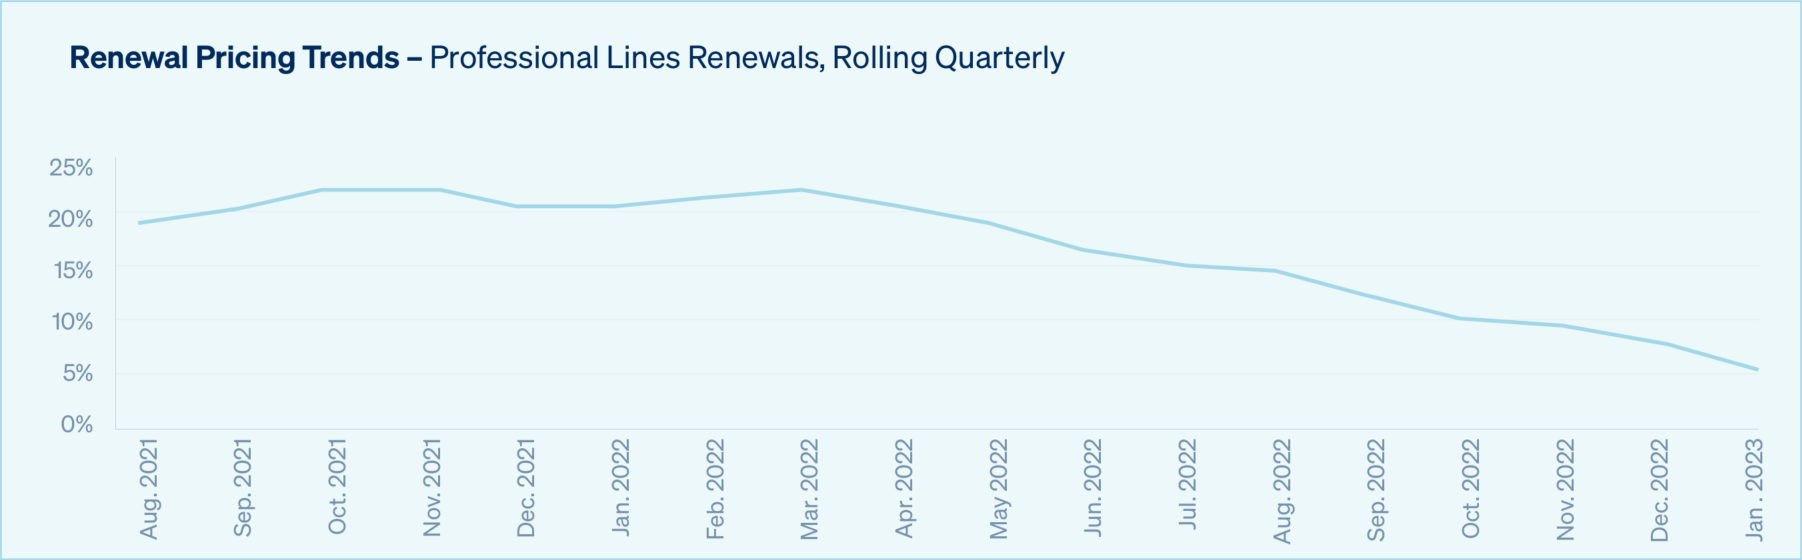
Professional Lines
Professional lines of business have been relatively stable with rate increases slowing overall. There are notable trends occurring in the following segments.
Directors & Officers Liability (D&O)
A wide range of factors are contributing to an overall softening D&O market.
Capacity is plentiful as new entrants to the marketplace aggressively price risks to capture market share. Previously these markets had been largely excess players, but many are releasing and reprioritizing primary market share in the changing environment.
Outside of the newer markets, existing carriers are seeking to redeploy capacity on renewals where they had previously cut limits and/or chase classes of business they had paused on writing during the pandemic. On larger towers this results in certain incumbent markets getting squeezed out and the remaining incumbents hitting targets to keep the new capacity from getting involved. There is an increased focus for towers to normalize with “established carriers” putting up more capacity and an increased focus on utilizing admitted and highly rated paper when available.
Global stock market turmoil led to a collapse in IPO and SPAC activity last year, removing the main new business pipeline for many U.S. and London D&O insurers and creating a supply and demand imbalance. Certain markets are chasing opportunities further downstream than where they had been focused in the past 12 months.
Within the primary layer we are seeing most carriers initially target flat to a slight decrease unless there are exposure-based reasons for further changes. When there is competition on a placement, the insured often benefits from the market aggression. Certain placements, like first year IPO renewals, are undergoing a dramatic shift in available capacity and the pricing/retention are dropping materially for the program.
At present, macro-economic concerns aren’t driving overall portfolio underwriting changes, but should recession concerns rise and debt facilities become more challenging for insureds to service, the marketplace may react. Insurers are also watching the longer tail D&O claims that were put on the back burner during the pandemic. When courts closed, the backlog of open issues only grew. Established insurers have meaningful cases to settle going back a few years. If those develop worse than expected, the D&O market may start to firm up again – regardless of newer capacity.
In London, pricing is dropping on both primary and excess layers as a result of competition from new market entrants. Rates have dropped dramatically in excess layers, while softening in primary is more subtle. While London is not seeing any major changes to policy exclusions, the steady number of claims could be a factor in how the market develops over the next few years.
Employment Practices Liability Insurance (EPLI)
In our last report, we told readers that underwriters were carefully watching claims and court outcomes to see what issues might arise post-pandemic.
As it turns out, there has not been near the frequency or severity of claims the market was anticipating in ether the U.S. or London markets. Thus, carriers are back to writing new business and rates seem to be tapering off after increasing the past few years. London markets are starting to reduce rates, especially for target industries such as property managers and staffing (outside of California).
During the pandemic, some U.S. carriers had attempted to put vaccine-related exclusions and coverage restrictions on policies, but such exclusions and restrictions seem to be disappearing.
California continues to be the most difficult state to place EPLI policies for both the U.S. and London markets. Some carriers are not writing in the state at all, and for those that do, minimum retentions start at $25,000 or higher. Obtaining wage and hour coverage also continues to be difficult in California.
D&O and EPLI markets can harden during a slide in the economy or a recession depending on triggers and factors. As we continue to watch for a possible recession, we should be prepared for new potential challenges in these markets.
Lawyers Professional Liability (LPL)
Carriers that serve the small firm segment (under 10 attorneys) are primarily utilizing MGAs or state/local bar association endorsements. This segment is very price sensitive and rate increases are on average less than 5%.
The mid-size segment (11–100 attorneys) currently has the attention of many LPL underwriters who see this as a space where they can compete for a significant amount of premium, while deploying no more than $5 million in capacity, and avoiding the claims volatility seen in the large segment. Some markets are willing to compete for new business in this space by using per attorney rate reductions and expanded coverages.
The large segment (101+ attorneys) is experiencing rate increases on average of 7.5% with carriers seeking double-digit rate increases for those firms with recent claims experience. This segment is also seeing carriers reduce primary capacity and request their insureds accept increased retentions. Some markets have elected to withdraw entirely from the large firm segment due to poor loss history.
As primary carriers reduce or limit their capacity offerings, excess markets have been attaching at historically lower limits. As a result, losses have breached the excess layers over the past 12-18 months and markets writing excess LPL are increasing their requisite percentage of premium charged by the primary underwriters.
The increase of ransomware attacks on law firms has made carriers realize that current rate and policy forms do not account for cyber exposure. Expect to see more absolute cyber exclusions in the months to come
Media Liability
Media liability insurers currently face some interesting challenges including:
Streaming Services—As more content is created and disseminated online, streaming services have an increased interest in a single combo policy that can cover Media Liability, Cyber Liability and Technology E&O exposures. Media liability insurers, however, have pulled back on capacity and/or restrict underwriting guidelines for this class, which has made it difficult to offer a single policy solution. This is especially true if the coverage focus is on pursuing an occurrence media liability form as opposed to claims-made form.
Non-Fungible Token—Media liability markets are still struggling with how they can deploy coverage for NFTs, especially where artwork or images make up the underlying content. Most NFTs include a license that limits the buyer to use, display and copy the NFT, but not necessarily exploit for commercial purposes. Generally, the copyright ownership of the underlying content does not transfer to the buyer of the NFT.
“Deep Fake”—As technology advances, the use of Artificial Intelligence and other techniques to manipulate audio/visual content is gaining popularity. Some videos replace or edit out an existing image/person with an image of another, creating a misleading or different story line that confuses viewers into believing something other than the original version occurred. This creates a variety of exposures for media liability, cyber liability, technology E&O and more.
Cyber
See special section of this report.
Select image to view larger
Insight provided by:
- David Lewison – EVP, National Professional Lines Practice Leader
- Selvin Green – AVP, Assistant National Professional Lines Practice Leader
- D&O – Michael Gautreaux (VP, Amwins Brokerage); Oli Doran and David Taylor (Amwins Global Risks)
- EPL – Joe Robuck (EVP, Amwins Brokerage), Kirsty Mitchell and Alex Marsh (Amwins Global Risks)
- Lawyers – Bill Schmitt (SVP, Amwins Brokerage)
- Media Liability – Jeremy Huang (SVP, Amwins Brokerage)

Reinsurance
Property Reinsurance Market
Following the turbulent January 1 reinsurance treaty renewal, the property market has entered the most difficult period since 9/11.
Renewals played out largely as anticipated with buyers eventually managing to complete most of their reinsurance placements. However, the meaningful withdrawal of retrocession capacity, investor fatigue with volatile reinsurer results, a host of geopolitical and macroeconomic shocks, and the compound effect of multiple catastrophe events in every major region have precipitated a profound change to what kind of reinsurance capacity can now be purchased. Unlike post Katrina and 9/11, we have not seen a rush to provide more capital to this space.
Despite the rate increases of the last three years, most reinsurers view the current pricing on CAT property risks as insufficient to compensate for the ongoing level of uncertainty. The January 1 treaty renewal was marked by a reduction in the number of reinstatements, higher pricing throughout programs, and a diminished appetite for extended upper limits. In addition to price and capacity availability, there was a significant increase to retentions, coverages were restricted to named perils, occurrence definitions tightened, and there were far more non-concurrent term “private” placements.
Large increases in written premium during 2022 have resulted in some aggregate issues for several larger reinsurers who will be carefully monitoring what additional exposures they will add to their portfolios going forward. This is particularly related to exposures in Florida, the Gulf Coast, and areas of serious convective storm potential.
Be on the Lookout
These developments will result in greater dislocation in commercial accounts as carriers and reinsurers reduce available limits and carefully select how and where they will deploy their limited capacity. Cedants are likely to seek increased facultative support to protect their increased net retentions but that will be contingent on how reasonable pricing will be from the facultative reinsurers.
Almost universally, facultative reinsurers are “rightsizing” their lines which will put additional pressure on completing larger placements. Given this, it will be increasingly difficult to complete higher layers on programs where cheap reinsurance capacity was once plentiful. In addition, most facultative reinsurers will only quote within 30 days of binding, so this will conflict with the practice of sending accounts into the market months in advance for early completion.
Casualty Reinsurance Market
As property catastrophe risks become more problematic, carrier appetites for casualty and specialty primary lines increase because they follow more stable and predictable patterns.
MGAs entering this space have put pricing pressure on traditional carriers hoping to retain renewals. Social inflation and excessive jury awards continue to create issues in the sector, but most programs can be completed at competitive levels.
Buying on auto, general liability (GL) and New York contractors is brisk and lower limits are generally completed at competitive pricing. Higher excess limits are more problematic and will remain so for the remainder of the year.
Be on the Lookout
While the long-term nature of casualty lines usually provides the opportunity to generate investment returns and reduce liquidity risk, current inflation has led some to question if the investment returns on policies written over the past several years will be enough to cover inflationary costs of potential future claims.
Insight provided by:
- Rich DiClemente – President of Amwins Re
- Tim Graff – EVP with Amwins Access in Charlotte, NC
- Troy Santora – EVP, E&S Leader with Amwins Access

Construction
Overall Segment Trends
Across the construction industry, inflated material prices, supply chain issues and worker shortages are delaying construction projects resulting in the need for significant extensions that are increasingly difficult to obtain. Some carriers are walking away due to delays, with replacement capacity hard to come by.
Not only has the market hardened with escalating reinsurance costs since these projects were originally rated, but the insurance to value (ITV) assessment also needs to be recalculated thanks to cost increases in raw materials and labor.
Adding to the drama in some markets are delays in obtaining the Certificate of Occupation (COO) permit that allows permanent insurance to take effect, thus terminating the builder’s risk policy. In some regions, projects remain stuck at 95% completion awaiting the COO. This puts contractors, who are obligated to maintain liability coverage, in the position of shopping for additional insurance at exorbitant rates and deductibles.
In the crane and rigging space, many carriers and MGAs are revising their risk eligibility classifications and underwriting procedures as well as combating underwriter staff shortages. These changes have led to the non-renewal of certain accounts.
Many markets have lowered their minimum premium on contractors to capture more “small business.” This means that MGA and brokerage markets are competing for the same business.
Builder’s Risk
Capacity and Pricing
For standard/ground-up projects, overall pricing has leveled off and remains consistent, with London competing on price with domestic carriers.
Projects are becoming more expensive midterm, which is making it difficult to find midterm capacity due to the rising cost of materials and increased lender requirements.
Coverage for renovations is still very difficult to place, particularly if it involves structural changes, therefore engineering reports and current property condition reports are essential. In London, the volume of wood frame inquiries has increased, but there remains limited capacity for the business sector.
Builder’s risk placements in wildfire and other CAT-exposed areas continue to be a challenge and rates and deductibles are continuing to climb. In addition, small and mid-size businesses are required to provide more expansive coverages, such as completed operations additional insured on a blanket basis inclusive of residential operations. This coverage isn’t readily available within the binding marketplace and small brokerage markets have been called upon more than ever to meet the needs of clients.
Limitations and Exclusions
In general, we’re seeing a tightening of terms and conditions. Notably, both U.S. and London markets are seeing higher deductibles for convective storm, as well as increased deductibles for all-other-perils (AOP) and interior water damage.
Construction in areas with high crime scores continues to be an issue. Carriers either require enhanced security and/or warranties for fencing, lighting, camera services, etc. or they will decline to quote altogether. The most notable areas include Phoenix, Portland, Seattle, Los Angeles, Nashville, Atlanta, and Las Vegas.
Be on the Lookout
Due to an increase of inquiries and submissions, underwriters are increasingly more selective about the size and type of risk they will consider.
To ensure the best terms for your clients, prepare submissions early and include all the relevant data required to assess the risk—scope of work, terms of project, safety, AOP mitigation strategies, etc.
Casualty
Capacity and Pricing
Overall, more capacity is entering the market than exiting, but most seems to be chasing the same deals. Therefore, tough markets remain tough but clean accounts with good loss history are seeing competitive pricing. Certain types of accounts remain challenging, such as demolition, superstructure and scaffolding.
General liability and lead excess are relatively flat to +5%. New entrants are creating a competitive market on pricing above the $5 million excess layer. For small business markets, pricing increases have been seen so far in 2023 as carriers look to offset their 1/1 reinsurance increases.
The Florida “for sale” residential construction market continues to be an ever-changing marketplace. The lack of consistency on claims payouts has created fluctuating prices as carriers struggle to be profitable in the current market conditions.
Some capacity for renewable tract/condo work in construction defect states has exited due to loss results, which is firming that niche arena.
Limitations and Exclusions
Wildfire in California remains a major challenge—most carriers either will not entertain a risk with the exposure, or they’ll exclude the peril entirely. There is a continued pushback on course of construction exclusions on project policies. And we are beginning to see more policies with PFAS exclusions.
Be on the Lookout
With the courts now open, carriers are watching the results of jury claims. The verdicts will no doubt impact future pricing.
In the small business space, the sustained hard market, and especially difficult conditions in property, has many insurance companies looking to balance their books with more casualty business, specifically contractors. Contract binding markets continue to evolve and create a stake in the casualty sector. Their product refinement is moving slowly, but we expect to see results later in the year.
Complete, quality submissions are necessary to achieve the best results for your clients.
Insight provided by:
Property
- Tina LaRocca – EVP with Amwins Brokerage in Irvine, CA
- Brooke Ledbetter – Vice President with Amwins Brokerage in Los Angeles, CA
- Kerry Pecora – Senior Underwriter with Amwins Specialty Risk Underwriters
- Gary Keenan, Laura Meyer and Alex Ramanos – Amwins Global Risks
Casualty
- Gary Ricker – EVP and Construction Practice Leader with Amwins Brokerage in New York, NY
- Jett Abramson – EVP and Construction Practice Leader with Amwins Brokerage in Scottsdale, AZ
- Scott Jensen – EVP and Construction Practice Leader with Amwins Brokerage in Satellite Beach, FL
- Mary Wisely – Managing Director with Amwins Program Underwriters’ Crane and Rigging Program
Small Business
- Dan Capone, Kristin Jones and Wes Mitchell – Amwins Access

Energy
Overall Segment Trends
While some insureds in the energy industry report double-digit growth in revenue due to inflated fuel prices, costs are also up across the board in every sector of energy as insureds face the same supply chain issues as the rest of the world.
Sanctions on Russia continue to push energy prices even higher around the world as the restricted energy supply struggles to meet historically high demands. Insureds and brokers need to be especially vigilant in analyzing how supply chain issues might impact business interruption (BI) losses.
Losses throughout the sector have underwriters putting greater focus on loss control and taking a more cautious approach to underwriting, including monitoring line sizes.
U.S. Pricing and Capacity
The onshore energy industry has seen rate increase between 10% and 25% on clean business. This is due to large business interruption losses extending over longer periods thanks to supply chain as well as multiple losses exceeding $500 million and increased frequency in the $50 million to $250 million range from operational losses. Overall loss estimates in the sector are approximately $4.5 billion, not including natural catastrophe losses, against an estimated $3 billion of premium collected.
Adequacy of reported values from insureds due to inflation are a key focus for underwriters. Many markets are adding a default increase to insureds who don’t provide value adjustments for inflation or have recent appraisals.
In the oil and gas space, we are seeing pricing rise as exposures increase. Most of the $25 million to $50 million placements have been cut over the past 24 months, but markets are still watching their overall book aggregate and attempting to reduce exposure.
Solar sectors have been riddled with losses, especially in Texas, causing a decrease in capacity for severe convective storm which has resulted in a pricing increase.
The power sector has also seen some shock losses along with attritional losses that are leading to tightened capacity. Larger energy placements have larger volumes of supply allowing for better renewal results by displacing opportunistic capacity from 2020 and 2021 renewals.
While a reprieve from the hardening market seemed to be on the horizon, more major markets have pulled back their capacity in the past couple of months due to a challenging reinsurance renewal season and continued losses. On clean accounts that have increased exposures and drilling activity, some markets have shown a willingness to offer flat to minor rate increases (5% or less). However, for other clean insureds that have not experienced similar growth, rate increases between 10% and 20% have been more common.
The saltwater disposal industry in particular is increasingly more challenging to place as many markets are pulling out of the space entirely or significantly limiting its coverage.
Additionally, minimum premiums are increasing across the board which will greatly affect small-to-medium sized insureds. Domestic markets, whose minimums have been by far the most competitive, have almost doubled year-over-year.
The markets that remain in the space are cautiously optimistic about the industry’s future. However, they are more hesitant in growing their book due to outside pressures and maintaining profitability.
Market rates have begun to rise due to a large uptick in claims and a continued reduction in capacity. Rates will likely increase 5% to 10% over the next 6 to 12 months, which is a reversal of where rates were heading last summer. Certain pockets, such as lead excess, will remain one of the toughest places in the marketplace. For accounts with claims, rate increases could easily push above 10%.
A large frequency in auto claims and payouts continue to adversely affect the excess market and some carriers have stopped offering excess coverage over the auto liability. The midstream market has also been plagued with claims and will continue to see rates rise throughout 2023.
Upstream is at a crossroads with large reductions in capacity and markets pulling out of the space altogether. This will cause rates to rise and premiums to skyrocket from where the marketplace has been over the past couple of years.
While some new carriers are offering GL and excess coverage for solar exposures, workers’ comp claims in this class are on the rise. Since solar exposures are similar to roofing, some markets are adjusting the underwriting process to reflect the similarities. As a result, some markets are declining to offer terms or moving out of the space altogether.
Absolute cyber exclusions continue to be pushed across the entire sector. Casualty markets are seeing more exclusions for Care, Custody and Control under GL forms, so it’s important to check the policy terms and conditions.
The recent Supreme Court ruling stripping the Environmental Protection Agency (EPA) of its power to restrict greenhouse gas production could have some interesting effects on energy generation. The federal government could offer direct financial incentives (grants or low interest loans to upgrade equipment) to encourage companies to adhere to regulatory standards.
The Inflation Reduction Act is expected to have a large impact on renewable energy, propelling more green energy projects into fruition. The associated tax credits and potential grant funds will spur projects that were already planned and push forth new projects for solar, wind and hydrogen. We expect this will accelerate the installation and development of renewable technologies, putting pressure on the insurance community to find creative solutions to insuring this growing area of risk.
Bermuda
The Bermuda market largely mirrors the U.S. markets with a few notable variations.
Bermuda remains strong for energy with oil and gas being a mainstay. The market will entertain business in all stages of the value chain, including upstream, downstream, and midstream as well as utilities. There is a particular appetite for high excess limits in the tower, much of which is placed using the Bermuda market form. In the case of utilities, the ability to secure wildfire coverage is very difficult. There has also been an increase in appetite for renewable energy business, although the market remains limited.
Additional casualty capacity has emerged in Bermuda over the last 12-18 months via new markets, however this has been somewhat offset by existing markets deploying less capacity. As a result, more markets are needed to complete layers/towers. However, with this new capacity, there is an increased appetite to deploy capacity at lower attachments in the tower.
Exclusions for any business activity in Russia and Ukraine are being applied across the board, and property markets will decline business in the absence of current and adequate valuations.
London
Updated loss figures for 2021 and 2022 show that downstream energy losses have exceeded premium collected in both years. In fact, since 2016 there has only been one year (2020) where global downstream premium exceeded losses.
Due to the sector’s poor loss history, there will be less competition and aggressive market alternatives to incumbents. Large programs that are well engineered, have low exposure to natural catastrophes, and are currently oversubscribed may not see rate increases. However, most other accounts could see single digit rate increases, and those with poor engineering and high exposure to natural catastrophe could see more.
Environmental, social and governance (ESG) pressures continue to reduce underwriting appetite for oil sand projects and anything to do with coal.
In the upstream space, capacity continues to leave the London market. A handful of major players in the space have announced their exit with more expected by year’s end. Reasons for the departure range from ESG to profitability.
Be on the Lookout
Underwriters are still adamant that accurate asset values need to be declared and given current global inflation rates and supply line issues, values should increase from prior year. This in turn will generate increased premium, which will take some pressure off rate increase in some circumstances.
Since the Colonial pipeline was hacked in 2021, more markets are asking about cyber protections. With good protocols in place, markets have been willing to provide coverage.
Insights provided by:
- Ben Abernathy – VP and Energy Practice Leader (Casualty) with Amwins Brokerage in Atlanta, GA
- Loren Henry – VP with Amwins Brokerage in San Diego, CA
- Mark Ritson – Senior Broker, Energy with Amwins Global Risks
- Matthew McDougald – VP with Amwins Brokerage in Houston, TX
- Rob Battenfield – SVP and Energy Practice Leader (Property) with Amwins Brokerage in Houston, TX
- Kayla Bridgewater, Rukiya O'Connor, Makeda Goater, Alan Waring, Alan Mooney and Chris Knight – Amwins Bermuda

Environmental
Overall Trends
Overall, the environmental sector continues to grow with stable rates and new entrants into the space. In addition to growing concerns over climate change, the industry is seeing impacts from lawsuits and governmental programs.
As courts resume normal schedules following closures during the COVID-19 pandemic, the number of lawsuits involving Pollution Liability (PL) claims is on the rise as well as the severity of judgements.
The passage of the Infrastructure Investment and Jobs Act (IIJA) created a construction and energy-related boom, causing many environmental markets to step up to fill the need for combined casualty and pollution solutions for the renewable space. Accounts most affected include commercial solar and solar farms, anerobic biodigesters (farms using their animal waste or food waste to extract methane, etc.), electric vehicle station contractors (construction and maintenance), directional drillers running
pipelines for offshore wind farms, wind turbine maintenance, battery energy storage operations and maintenance, and renewable technology development. Purchasing environmental coverage for these types of accounts will protect insureds from costly claims as the IIJA is implemented.
Capacity and Pricing
Capacity remains stable with as much as $500 million available for large risks. However, securing desired limits remains difficult and expensive in some higher hazard classes, such as oil and gas, mining, chemical, habitational and hospitality, and typically
requires multiple insurers to meet insureds’ needs.
MGAs continue to enter the space, with two new markets providing additional capacity in the last few months. Combined casualty and pollution products have significantly expanded their appetite for manufacturing, providing a comprehensive solution in one
package.
As discussed in our last report, environmental markets that historically limited coverage to chemical manufacturing and environmental products continue to offer coverage options for “non environmental” building materials, cosmetic manufacturing,
energy products and furniture.
The number of markets writing contractor and developer operations continues to grow, with some now offering a combined pollution and professional package that includes site pollution and contractors pollution liability (CPL) functioning as a wrap or practice
policy for site owners/developers.
A variety of policies are available to contractors and project owners depending on the site exposures and materials used.
Limitations and Exclusions
We continue to see contaminant exclusions for per- and polyfluoroalkyl substances (PFAS), and we can expect this trend to continue as the Environmental Protection Agency (EPA) moves to designate PFAS as hazardous substances under the Comprehensive Environmental
Response, Compensation, and Liability Act (CERCLA) aka Superfund.
If finalized, the rule would require entities to immediately report releases of PFOA and PFOS that meet or exceed the reportable quantity to respective emergency response teams. Any entity deemed responsible for contamination would then be forced to pay
to clean it up regardless of fault.
This designation would create issues for businesses and sites with PFAS exposure but will ultimately create more opportunities for environmental contractors and consultants dealing with the cleanup of these sites.
Additionally, the EPA is putting substantial resources into regulation enforcement—resulting in more fines, penalties and claims. Exposures that may have previously gone unnoticed or ignored are now receiving attention due to the heightened focus
on pollutants.
If this trend continues, we are likely to see an expansion of exclusions in pollution coverage.
Be on the Lookout
Over the next few months, the EPA will make a final judgement on the hazardous status of PFAS, which will have an immediate and costly impact on insureds with potential risk exposures. Many carriers feel this will have far reaching effects for multi-year pollution policies without a PFAS exclusion and for casualty business where policies date back before 1985 and did not have a pollution exclusion.
Another emerging contaminate is 6PPD Quinone which is likely to be regulated in its permit when reissued in 2024. This chemical is an additive to tires used to stabilize rubber and prevent cracking. Recently it was linked to mortality in coho salmon caused by runoff in water. Industrial companies along with sand and gravel and municipal permits may see monitoring requirements for it soon.
Another issue to keep an eye on is Sackett v. EPA which is currently pending before the Supreme Court involving a question of how broadly the U.S. EPA can read “waters of the United States” for the purpose of the Clean Water Act. This case is important because it will define the boundary line between federal and state regulatory authority which will directly affect where the EPA can impose fines related to wetlands.
As the IIJA takes shape and embarks on the 10-year journey to refocus government efforts to tackle the climate crisis and expedite environmental justice, among other things, this heightened focus on infrastructure-related initiatives and corporate environmental impact will be felt by insureds needing additional coverage across a variety of classes of business.
Retailers should take steps to prepare their clients for these imminent changes. Environmental liability insurance is not a cookie cutter product, and every policy can be customized, making it extremely important for insureds to work with knowledgeable wholesale brokers who can identify and fill in gaps in coverage as well as provide guidance on risk-mitigation practices.
Insight provided by:
- Daniel Drennen – VP and Environmental Practice Leader with Amwins Brokerage in Birmingham, AL

Healthcare
Overall Segment Trends
Healthcare liability remains a challenging market even years after the start of the COVID-19 pandemic, however we are seeing softening in certain pockets.
Staffing shortages and early retirement of nursing professionals during the pandemic created opportunities for large staffing companies—with nursing hours oftentimes doubling and tripling in a short period of time. This trend, however, also put more scrutiny on the protocols, procedures, and hiring practices of staffing agencies.
Senior care facilities—already thinly staffed on average—are having an increasingly difficult time hiring and retaining staff in a tight labor market. This increases risk exposures and lowers defensibility for these facilities which could lead to more frequent and severe claims.
The economy is putting pressure on insureds to reevaluate how they spend money. And the decrease in purchasing power is pressuring some healthcare clients to look at cutting costs in their insurance programs by lowering limits, taking on higher deductibles, etc.
New regions have been added to the list of “more difficult venues” due to heavy litigation. States once thought of as ideal markets—such as North Carolina and Georgia—can prove challenging depending on the class of business. Taking effect in January 2023,
plaintiffs in Pennsylvania may now sue in any county in which care occurred, where a defendant can be served, or where the transaction or occurrence giving rise to the suit took place. This could encourage plaintiffs to move cases to less conservative counties.
Pricing & Capacity
Pricing continues to stabilize with renewal rates going from single digit increases to flat renewals as new market entrants put pressure on the larger markets. Some med mal accounts are even seeing rate reductions at renewal.
Unlike the previous capacity we saw enter the hard market in 2004, these are experienced healthcare underwriting teams that bring new perspective and offer competition, helping to slow rate increases. Many new capacity providers are seeking significant premium growth in 2023.
Excess capacity is still tightening as carriers cut back on limits for certain classes—a tactic that creates difficulty for insureds dealing with increasing social inflation and higher jury verdicts in historically conservative areas.
In the senior care market, rate increases have decreased from the mid-teens to single digits. New capacity is beginning to emerge, especially for assisting living facilities. The reduction in rate is a function of existing capacity looking to regain or maintain market share as well as new capacity pushing pricing down. With claims severity trending upwards, however, another round of rate increases is likely in the long term.
London markets are not looking to offer rate reductions within certain classes, including hospitals, inpatient psychiatric, and correctional facilities. Despite strong competition, even hospitals with no claims history are seeing 10-15% rate increases. The London market is also
seeing competition in the misc. facilities/allied health space, with success in classes such as pharmacies, allied staffing, home health, labs, and surgery centers.
Limitations and Exclusions
Extended Reporting Periods (ERP) are being offered at the time of request in lieu of ERP percentages and language being automatically written into the form.
Numerous lawsuits have been filed alleging HIPAA violations based on companies’ usage of pixel tracking and subsequent sharing for purposes of targeted advertising. Due to the massive loss potential, many cyber carriers are adding exclusions to preclude cover for these types of losses.
Several carriers have implemented form updates to better clarify the intent of their coverages. Some carriers integrated commonly used endorsements or tightened up previous ambiguous wording.
Some London markets are addressing sexual abuse exposures by adding wording which clarifies coverage.
Be on the Lookout
While we expect renewal rates on many accounts to be flat or have modest increases, certain classes will be higher. Have early discussions with your clients—it’s always easier to deliver tough news early. We do, however, expect to negotiate better coverage for our clients as new markets emerge and apply pressure to existing carriers.
We anticipate the market will continue to soften with carriers getting more comfortable expanding their appetites and opening to classes they previously would not consider.
The market seems to be slowly opening to residential exposures like drug and alcohol rehab facilities and we continue to see new markets enter the long-term care space.
We will continue to follow COVID-related claims in states with immunity to determine how well the immunity holds. With courts now open, we are experiencing more verdicts and expect losses to trend up after being on hold for so long.
Senior care insureds should be careful about new capacity within the specialized niche market. A new carrier may offer better pricing or terms, but if inexperienced staff mishandles claims, it can lead to higher losses and possibly non-renewal or unfavorable terms based on the insured’s increased loss history.
Insight provided by:
- Daisy Morris – Broker, Professional & Financial Risks with Amwins Global Risks
- Jordan Connelly – EVP with Amwins Brokerage in Atlanta, GA
- Matt Wasta – Program Manager of Amwins’ Senior Care Program.
- Phil Chester – EVP and Healthcare Practice Leader with Amwins Brokerage in Farmington, CT

Public Entity
Property Trends and Pricing
In general, the public entity sector hasn’t fared much differently from the overall commercial property market with tough reinsurance treaty renewals (particularly in CAT capacity) and a focus on adequate valuations. The 2022 storm season exacerbated the growing trend of carrier capacity limitations and rate increases. The market is expected to continue to harden over the next 12-18 months—especially in CAT-prone regions
Data quality will continue to be a critical factor for carriers when considering risks. Simply put, it’s essential for new business submissions and renewals to be as complete and detailed as possible. Unfortunately, we’re seeing more underwriters
assume the worst-case scenario when pertinent information related to a risk is left out of the submission process.
One trend we’re starting to see is the extended time taken to process and close claims. For example, we are still seeing open claims from Hurricane Ida in 2021 with outstanding repairs needed along with increased cost in these claims. The procurement process that many public entities require for quoting contractors has resulted in delays and increased costs due to supply chain issues and high inflation. Carriers are becoming leery of unexpectedly higher losses along with existing damage and are taking this into account in risk evaluations.
Another challenge facing public entities is that markets are not providing quotes as early as they previously have. This causes issues for public entities who need the lead time for budgeting and approval purposes.
London and Bermuda
London continues to be a consistent partner with many new accounts in the public entity space. Since July 2022, the overall growth in this sector has been around 25%. As for Q1 pricing, rates are up 30% to 40% after January reinsurance treaty renewals. Even renewal accounts with a favorable loss history are likely to see rate increases as high as 20% to 30% along with higher retentions.
In Bermuda, we anticipate increased rates of 30%+ and some cuts in capacity for Tier 1 wind-exposed accounts. Public Entity business remains a preferred class of business for Bermuda markets.
Be on the Lookout
Public entity has traditionally benefited from broader terms and conditions, and while it’s too soon to know the full extent of upcoming limitations and exclusions (we will know more after the March renewal cycle), we can expect to see impactful changes across the board. Some perils will be stripped out of contracts, and the market will dictate higher deductibles. High-hazard risks will need to take higher retentions, and we can also expect high-hazard caps to disappear.
With the market difficulties facing public entities, willingness to adapt program structure will be critical for success in 2023. When capacity is priced out or not available, options might include pulling out CAT-only towers, lower AOP limits, self-insurance for certain parts of program, or exploring alternative market options such as parametric solutions. All of these should be discussed during the pre-renewal meetings so that public entities know what they may have to consider during the renewal process.
Casualty Trends and Pricing
The complex risk landscape in recent years has resulted in an exodus of both carriers and capacity in the public entity space. A recent ten-year lookback in the blended municipality liability market segment shows an approximate 63% reduction in actual number of markets participating in the space, resulting in a near 88% reduction in actively deployable limits.
Excess capacity has further been constrained by hesitancy from participating market treaty reinsurers towards public entities due to increased loss costs, nuclear jury verdicts, aging infrastructure, modified views of social responsibility, and litigation funding.
The primary and excess insurers that remain continue to adjust their pricing methodologies and available limits (higher costs and lower limits) to account for the increases in frequency, cost, and severity of claims.
In addition to inflationary forces (social, economic, and medical), this continued rate pressure can be attributed to growing sexual abuse and molestation claims at public K-12 school districts and higher educational institutions, civil rights violations by governmental entities (bypassing state tort caps), auto liability events, street and road design losses, active shooting incidents, and alleged wrongdoings and/or discrimination by law enforcement.
This trend has pronounced effect in states with joint and several liability, like California and Washington, where a single party in a multi-defendant lawsuit can be held responsible for economic damages up to the entire amount awarded.
Be on the Lookout
Much like their property counterparts, casualty brokers will want to consult with clients about adapting program structures and exploring alternative market options. We are seeing a shift toward increased risk retentions among individual risks and municipal pooling entities. Also gaining interest are alternative approaches such as the use of corridors/annual aggregate deductibles or structured solutions with stretched aggregates across multiple years of coverage.
It will also be critical to communicate credible and organized loss content during the submission process along with associated predictive analytics and details on any risk mitigation tactics and strategies.
London and Bermuda
The Bermuda and London markets are now more closely aligned with domestic markets in terms of capacity, coverage, and pricing. International market pricing and capacity varies depending on coverage and attachment.
There is new capacity and a steadily growing appetite in Bermuda for public entity business and renewed interest in London, however, so far this has mostly been used to fill gaps left by domestic
markets. With less capacity being offered across the board than in the past, more carriers are needed to fill layers, especially lower attaching layers, and thus it is taking longer to complete towers. Markets in Bermuda and London are expected to maintain a continuing, albeit cautious, interest in the public entity space.
Law enforcement liability, sexual molestation liability, and utility/wildfire exposures are a significant concern for international markets. Coverage can be obtained, but underwriters are digging deeper to see if they will entertain certain exposures. Aggregation of exposures in difficult states such as California and Washington will continue to be a challenge. Claims made coverage can be a mitigating strategy to obtain underwriting support. The quality of loss and exposure data, including risk management initiatives, and the willingness to invest time in helping underwriters understand the breadth of exposures will be key to getting deals done.
Be on the Lookout
Moving forward, public entity accounts that can effectively demonstrate sufficient risk management and loss control protections, along with appropriate risk profile attachment points and credible TIV data, will have an easier time securing the coverage they need at a competitive price. We expect this trend to continue well into 2023.
Insight provided by:
- Brian Frost – EVP and Public Entity Liability Practice Leader with Amwins Brokerage in Woodland Hills, CA
- Darron Johnston – SVP and Public Entity Property Practice Leader with Amwins Brokerage in Atlanta, GA
- Ali Hoefle – AVP with Amwins Brokerage in Dallas, TX
- Ed Fussell, Steve Knight and Tom Whitehead – Amwins Global Risks
- Kayla Bridgewater, Rukiya O'Connor, Makeda Goater, Alan Waring, Alan Mooney and Chris Knight – Amwins Bermuda

Real Estate
Property Segment Trends and Pricing
The inconsistencies of today’s economic environment and
catastrophic weather patterns have created both direct and indirect hard markets in real estate where all classes of business can expect to be impacted for the foreseeable future.
In cases where insurers have paid out more claims than premiums received, we are seeing a traditional direct hard market where rates are increasing and coverages are being restricted.
In other cases, however, an indirect hard market has resulted not from mounting losses, but rather from well-capitalized insurers and reinsurers getting more conservative about their books of business and choosing to reduce line sizes and/or exit market segments to de-risk their balance sheets.
For instance, Florida real estate accounts continue to redefine ‘hard” as they experience both direct and indirect market challenges. And while it’s too soon to know the full impact of the December
property insurance reform act, it is safe to say the Florida market would have ground to an absolute halt without it.
As reinsurance treaty rates continue to rise and carrier retentions meaningfully increase in many cases, carriers will factor their reinsurance renewal results into their coverage and rate change requirements. We experienced carriers and MGAs waiting to quote December 2022 business until very close to effective dates to have as much certainty as possible regarding their reinsurance renewal result and carrier panels. We anticipate this same approach from carriers as other key 2023 reinsurance renewal dates approach.
There is now a capacity crunch unseen since 2006, with demand outpacing supply. Many insureds, particularly those with Tier 1 and Tier 2 named storm exposures and those with challenging classes of business or loss history, will experience named storm sublimits or program loss limits as the amount of expiring coverage or program limit either will not be available in the marketplace or will be cost prohibitive.
Compounding the problem is line size reduction by many carriers and MGAs. Certain MGAs for instance are meaningfully reducing capacity from full limits or large loss limits to primary layer or quota share capacity within a primary layer. Many carriers are reducing line sizes by 25% to 50%, depending on account specifics, geography, and class of business. The result is more carriers needed to fully subscribe a placement. With more participating carriers comes the possibility of different forms/exclusions and resulting non-concurrencies within a program. Agents and brokers should be diligent when reviewing carrier quotes.
Renewal pricing will vary substantially for many reasons.
- Accounts that are non-renewed by the incumbent carrier(s) or that experience substantial capacity sign-downs overall often experience the most dramatic renewal rate increase as additional carriers are then needed to complete the placement.
- Appropriate valuation continues to be a major concern for carriers, with undervalued accounts experiencing a “double whammy” of premium change comprised of increased valuation and market driven rate increase.
- Accounts with heavy losses or risk characteristics that now fall outside of many carriers appetites may also face some of the most challenging renewal outcomes.
Adding to the challenges detailed above, the marketplace continues to move slower than normal due to the extremely high submission volume, required actuarial involvement, number of referrals required, understaffing, etc. Therefore, sharing your fully updated renewal submission with your broker as early as possible as well as highlighting account advantages is highly advised.
London and Bermuda
All trends stated above are being echoed in the London market. At 1/1 reinsurance renewals, nearly all syndicates took on significantly higher rates and retentions (in some cases double). These pressures will flow down into the direct market.
In London, there remains a relatively limited market for habitational risks, and terms and conditions for this class show no sign of softening. Critical CAT remains incredibly tight, with many markets actively looking to shrink their books in areas such as Florida, Gulf Coast, and states with convective storm exposure. Texas remains very challenging regardless of class.
While London has traditionally been considered a primary market, which remains strong, we are also seeing a considerable increase in appetite for excess and buffer layers, especially where there is CAT exposure.
There are certainly headwinds across the whole of the E&S market, but London remains in a strong position with many Lloyd’s syndicates and company markets looking to grow in 2023.
In Bermuda, rate increases for real estate business have been felt across the board with no exceptions. Underwriters are particularly focused on maintaining rate adequacy for distressed classes and CAT exposed business. To address the issue of valuations, some markets are requesting a Values Limitation clause. The Bermuda market remains a significant source of excess capacity attaching above the PML for middle and large size accounts.
Be on the Lookout
In both the domestic and international marketplaces, carriers expect reported building valuations and rents/business income to be heavily scrutinized and upwardly adjusted as necessary prior to renewal submission.
Blanket limits cannot be taken for granted, with undervalued schedules now commonly receiving margin clauses, scheduled limits, co-insurance, and/or ACV valuation.
A row-by-row review of SOVs is now highly advised, with data quality and accuracy being paramount. Roof replacements, true gut rehabs, hurricane shutters, impact glass, accurate gross square footages, and accurate construction types are examples of data which should be accounted for within a renewal SOV. Until an SOV is finalized and shared with your broker, nothing can be completed from a wind modeling and target pricing/layering perspective.
With business flow into the E&S market continuing to increase, carriers and underwriters are now being even more selective in their overall appetite. Numerous carriers have invoked construction age rules which preclude them from considering opportunities prior to a certain year. Less competition is leading to meaningfully higher pricing in many cases.
Casualty Trends and Pricing
General liability rates for clients with favorable losses in low-risk states are remaining flat with increases up to 5%.
Clients in tough states like Georgia, Florida, California, New York and Texas, however, are seeing different results, especially on subsidized housing. Some carriers are shedding accounts they see as challenging to bring the real estate percentage of their overall books down.
In addition, minimum retentions continue to rise. For schedules over 2,500 units, it has become tougher to find retentions under $50,000 SIR with clean terms. There are possibilities of new capacity in the primary space, but it may be months before we see new carriers in this space.
The challenges of this sector reduce as you move up the tower. While lead $5 million capacity is still rare, there have been more carriers willing to look at short limit excess. For excess of $5 million (and especially excess of $10 million) the competition has grown, which has helped create more favorable pricing.
GL and lead excess markets will remain cautious in 2023 on risks that are majority subsidized housing. Most carriers have a firm stance on not entertaining those with more than 10% to 25% subsidized, whether Section 42 or 8.
Limitations and Exclusions
On accounts with assault and battery (A&B) losses or in states with a history of A&B issues like Georgia, Texas and Florida, the challenges to obtain full A&B continues to grow. Carriers may sublimit A&B, restrict it to a one-time $1 million/$2 million or $1million/$1 million limit, or raise the retention on A&B losses to as high as $500,000. In addition, there are a limited number of excess carriers open to providing excess A&B over these one-time limits. Another increasingly challenging section of real estate is senior housing with pull cords. Where carriers once had no issue, they now will either exclude those locations or underwrite extensively to find out what notification system the pull cord location uses.
Although some markets have cut back there remains meaningful capacity for real estate business in Bermuda, with pricing increases commensurate to domestic markets. Capacity is typically in the high excess, however, new market entrants will consider deploying capacity below $50M.
For risks with poor loss history, several Bermuda markets will entertain a structured approach for a lower layer. This is worth consideration for buyers who are willing to take meaningful risk but need some risk transfer and stability of cash flow.
In addition to the more common follow form coverage, an occurrence reported (OR) form is available that includes affirmative
punitive damages coverage, which would be of value to insureds with operations in states where insurance of punitive damages is prohibited.
Be on the Lookout
As underwriters become increasingly selective about the accounts they will write, accurate and complete submission information is paramount. Retailers should continue to educate clients on the importance of risk mitigation measures.
It has never been more important to show that the insured is not only proactive to avoid losses, but also appropriately reactive when loss occurs.
Small Business
The small business real estate market has been tightening over the past two years in terms of increased pricing, more restrictive coverage, and increased deductibles. Market capacity for small habitational accounts has reduced significantly in that timeframe as carriers decline to quote business with certain risk characteristics or business that is not performing well from a loss perspective.
The market is particularly challenging across the board in high crime areas, with some carriers pulling out of high-crime habitational business altogether.
Carriers have also started to limit or exclude A&B based on crime scores and animal exclusions have become mandatory with most carriers in recent years. This is a significant change from a few short years ago when full A&B limits or a sublimit could typically be obtained on any account.
Insight provided by:
- Bob Black – EVP and Real Estate Practice Leader with Amwins Brokerage in Atlanta, GA
- Corey Alison – EVP and Real Estate Practice Leader with Amwins Brokerage in Atlanta, GA
- Johnny Tolland – EVP with Amwins Brokerage in Satellite Beach, FL
- Jessica Stastny – EVP with Amwins Access
- Tom Keogh and Warren Hills – Amwins Global Risks
- Kayla Bridgewater, Rukiya O'Connor, Makeda Goater, Alan Waring and Chris Knight – Amwins Bermuda

Transportation
Overall Segment Trends
Nuclear verdicts and social inflation continue to plague the trucking industry with sizable awards impeding the cost of insurance—especially in Texas, Georgia, California, Florida, and Illinois. This situation is exacerbated by plaintiff lobbying groups continued push to increase minimum financial responsibility limits for commercial truckers.
The transportation sector has experienced a healthy amount of capacity as preferred markets become more flexible with underwriting guidelines and are willing to take on riskier accounts. Currently, rates for renewals remain relatively stable, with competition for new business intensifying.
Fuel prices and supply chain backlogs are beginning to stabilize and slowly show signs of improvement. The driver shortage, however, continues to challenge the industry with fewer qualified drivers. For many companies, this issue has significantly decreased fleet counts and revenue, and has caused milage projections to dip.
Some markets have already begun imposing a specific threshold for younger/inexperienced drivers, such as allowing only 10% or less of a company’s employed drivers to have fewer than two years of CDL experience. Accounts with favorable risk characteristics, however, will find underwriters more flexible on driver guidelines.
Primary Auto
For accounts that perform well, primary auto risk pricing continues to be favorable with minimal rate increases. However, more challenging risks are likely to see double digit rate increases if their loss history, CAB scores and driver profiles are going in the wrong direction.
That being said, many markets have strong growth goals in 2023 so we anticipate continued aggressive pricing on the best risks.
Excess Auto
Large losses in this space are causing continued capacity restrictions, some rate increases and movement to higher attachment points in large trucking towers. However, despite steady losses, carriers continue to show interest in the excess auto space, which has caused rates to stabilize overall. Many primary auto markets are entering the excess space—mostly in the form of supported excess over themselves. This has strained traditional excess markets and has the potential to impact the stability of primary programs.
Auto Physical Damage
The cost of new and used vehicles has substantially increased, and as a result, we are seeing frequent requests to increase vehicle values at the midterm. Higher towing limits are also being requested due to an abundance of costs typically exceeding the towing limit on many claims.
Demand and inflation have also impacted fleet values. We see this leading to a more conservative approach to rating and deductible structures by underwriters.
The cost of trailers has also increased dramatically, which impacts trailer interchange (TI) requirements (historically between $25,000-$60,000) and pricing. We’re now seeing an influx of lease agreements and TI agreements requiring $80,000- $100,000 in certain regions.
Moving forward, retailers with asset-based trucking accounts should instruct their insureds to take a hard look at the valuation of their equipment and their lienholder/leaseholder agreements, as demand remains high.
Motor Truck Cargo
Capacity for motor truck cargo remains plentiful, with underwriters focusing on loss ratios to select the better risks.
Freight rates, however, are up 25% to 30% since the beginning of the year. As a result, we have seen more insureds/retailers structuring annual audit policies based off projected mileage, as opposed to projected revenue, due primarily to increased revenues driving up premium.
The most significant increases to rate and deductibles have been target interest commodities, including auto haulers, boat haulers, pharmaceutical, and other refrigerated goods haulers. The markets with appetite for these high-risk commodities remain limited.
However, carriers are increasing deductibles for nearly all commodities, with many offering a minimum ($1,000) deductible on motor truck cargo.
London
2022 saw trading conditions in the London cargo market continue to improve, with most underwriters accepting flat renewals on accounts. Underwriters remain focused on CAT aggregates and have become more inflexible on accounts that don’t reach required technical pricing or where the risk management standard is below par. Underwriters have also taken advantage of increased rates to manage their line size while increasing minimum premium levels for open market placements.
While the hard market continues in the trucking segment, we have seen a slight reduction in rates. London underwriters continue to stay firm on driver criteria requirements irrespective of brokers continuing driving home the driver shortage issue.
For Hull and Machinery (H&M), the past year has seen rates levelling off, with clean renewals now looking at between flat and 5% increase. We are also starting to see syndicates hire H&M underwriters to grow their book or start up marine syndicates and new MGAs. This should lead to reduced prices or increased appetite for less desirable risks in Q1 2023.
The past year has seen up to 20% increases in the Mutual P&I market—driven by major losses and increased reinsurance costs—with no sign of this abating.
We have seen new capacity enter the ports and terminals market, particularly on lower layers. This class is still feeling the squeeze from heavy losses over the past two years and is seeing increases of 5-10% on clean business and more significant increases on loss-affected business.
The London marine liabilities market is open to new business with capacity available, but prices are increasing on all renewals. Clean business is seeing increases around 10% to 12.5%.
Be on the Lookout
Technology has played a strong role in making roads safer and some markets are placing specific camera or telematics systems on operations with inexperienced drivers. The goal, in part, is to educate insurers on how and where fleets are operating and help the trucking industry fine-tune rates and coverages.
An investment by an insured in tech packages can result in meaningful savings on insurance costs as more markets see great value in the deployment of these advancements. Brokers should expect more carriers to request their insureds share telematics data in return for premium savings.
Insight provided by:
- Andrea Dickinson – EVP with Amwins Brokerage in Nashville, TN
- Andy Simkins – VP with Amwins Brokerage in Chicago, IL
- Chris Moulder – SVP with Amwins Brokerage in Atlanta, GA
- Judd O’Neal – EVP with Amwins Brokerage in Chicago, IL
- Justin Joyce – VP with National Truck Underwriting Managers
- Matt Domitrovich – EVP with Amwins Brokerage in Chicago, IL
- Stuart Harmon – Senior Associate Broker with Amwins Brokerage in Chicago, IL
- Zach Bowing – SVP with Amwins Brokerage in Tampa, FL
- Andy Lee, Sean Oliver, Jon Humphreys, and Toby Kayll – Amwins Global Risks
Special Features

Cannabis
Overall Trends
The legal U.S. cannabis industry was estimated to
exceed $33 billion in annual revenue in 2022, more than double its sales from just three years ago. The cannabis insurance market continues to develop and expand despite the obstacles created by the discrepancy between state and federal law.
Further complicating the market, many insureds are seeking to reduce their insurance costs as cannabis prices continue to push downward and reduce operating margins. Cannabis businesses are consolidating to remain competitive against a black market that is thriving thanks, in part, to the lack of corporate tax benefits.
In January, the Food & Drug Administration (FDA) concluded that CBD cannot be regulated as a dietary supplement and punted the establishment of a new regulatory framework to Congress, perpetuating the legally gray status under which billions of dollars of products are currently sold. The absence of federal regulations and safety standards will continue to inhibit standard carriers from insuring the products, while the E&S market continues to offer robust coverage.
Following the explosion of the major cannabinoid market, minor cannabinoids are now making waves in the industry. One of the most popular minor cannabinoid products on the market, Delta-8 THC, was recently ruled by the Ninth Circuit Court of Appeals as federally legal under the Farm Bill’s definition of “hemp.” However, due to its intoxicating effects, some states are now pushing to ban availability in stores, illustrating one of the most difficult barriers to insuring minor cannabinoids—lack of federal regulation means legality is decided on a state-by-state basis.
Capacity and Pricing
On the casualty side, the market remains soft with many carriers broadening terms and undercutting incumbent rates. Many insureds tend to prioritize property capacity and terms in the absence of major liability claim activity.
The property market is relatively soft for non-CAT exposed risks with clean loss histories but remains firm for CAT perils. While high limit capacity remains relatively scarce, cannabis businesses have access to more cumulative property capacity in 2023 than at any time since Lloyds and Bermuda first exited the class in 2015. More sophisticated insureds are finding bespoke solutions via parametric markets that wouldn’t previously entertain the industry.
Competition is robust at lower property values, with the entrance of several new facilities focused on streamlining the notoriously painstaking underwriting process.
Price remains the primary driver in purchasing decisions by cannabis businesses as the already tight margins continue to be squeezed by inflation and competition.
The professional lines sector has seen more markets and capacity entering the space for management liability and D&O, offering insureds options to choose policies based on their budget. Coverage, retentions and rates for EPLI are comparable to what non-cannabis insureds are offered.
Less than 10% of cannabis companies are purchasing cyber coverage as minimum premiums increase and coverage is stripped down for insureds lacking proper controls and safety measures.
Limitations and Exclusions
Quality of coverage available to cannabis operations varies greatly, and proprietary forms continue to warrant scrutiny as problematic exclusions are not always apparent.
Cultivation lighting systems have become a critical underwriting consideration for property coverage, driven by losses caused by improper bulb usage and maintenance. Most carriers now require supplemental lighting information prior to quoting and may surcharge or decline risks with less favorable equipment or procedures.
For companies selling products containing minor cannabinoids, many carriers use endorsements to limit coverage. Some of those problematic endorsements include foreign products exclusions which encompass most vape devices as they are manufactured abroad.
A concern for product liability coverage comes with many MGAs using more restrictive claims and reported policy forms. The “and reported” aspect of the forms gives insureds much less time to file a claim after the policy period is over, making payout less likely. Insureds must either purchase an extended reported period or they must report any claims within 30 days of the policy period ending.
Be on the Lookout
Last July, Senate Democrats introduced the Cannabis Administration and Opportunity Act to the Senate floor, which sought to “decriminalize and deschedule cannabis.” That bill hit an anticipated stalemate in the Senate, and optimism that Congress would act on the more incremental SAFE Banking Act during the 2022 lame duck session did not come to fruition.
In spite of the lingering possibility of federal penalties, currently a reported 250 financial institutions service state-legal cannabis operations. The perception that the industry cannot bank is categorically false, although day-to-day operations are still cash-dependent as credit card processing remains out of reach.
Additionally, insureds involved with real estate investment trusts (REITs) should expect pressure to raise building valuations and meet increasingly strict insurance requirements. CAT exposures such as earthquake in California, named storm on the east coast, and flood throughout the country near A, V and X500 flood zones will receive additional attention from investors.
Further, damage losses from Hurricane Ian and the 2022 storm season in the Atlantic are likely to disproportionately impact cannabis businesses along the coast. The cannabis industry is uniquely under-insured for CAT losses due to very scarce availability of catastrophe reinsurance capacity. Lloyds pulled out of the U.S. cannabis market in 2015 and Bermuda has strict guidelines for restricted classes.
To stay up to date with these ongoing developments, remain on top of industry trends and ensure their clients are poised for the best coverage at the best price possible, agents should partner with a wholesale broker who has expertise in the cannabis sector
Insight provided by:
- Brian Savitch – SVP with Amwins Brokerage in San Francisco, CA
- John Deneen – VP with Amwins Brokerage in Denver, CO
- Justin Lehtonen – EVP with Amwins Brokerage in Los Angeles, CA
- Morgan Moore – EVP with Amwins Brokerage in Los Angeles, CA
- Norm Ives – Broker with Amwins Brokerage in Los Angeles, CA

Cryptocurrency
U.S. Trends and Pricing
As cryptocurrency becomes more widespread and the risks are better understood by carriers, we are seeing more underwriters cautiously open to writing coverage in the space.
In the U.S., property capacity has developed with new and existing carriers. Property coverage is available in the primary and excess spaces, with $5 million to $200 million limits available depending on the risk and layering with international capacity to reach the higher limits.
Two common exposures in the crypto/bitcoin space are ATMs and bitcoin mining.
The bitcoin ATM space has grown over the years and become much more common around the country. The biggest exposure for ATMs is crime onsite, therefore it’s important to ensure that A&B is not excluded from coverage. Additionally, many clients’ gross receipts are exponentially increasing year-over-year, so it is important to ensure accurate projections prior to binding to avoid large audits. Your broker can also negotiate built-in free growth or tiered ratings when possible.
Crypto/bitcoin mining is done using sophisticated GPUs (graphics cards) to solve algorithms; it involves a network of computers and uses a great deal of electricity. Therefore, one of the largest exposures for crypto mining is fire damage to the property. Valuation of the mining equipment can be on an actual cash value or replacement cost basis. It’s important to ensure that the entire premises is covered with no property-related exclusions. A clear understanding of the crypto mining business model is critical to secure the correct type of property policy— owner/operator, landlord/tenant, co-location, revenue share, etc.
On the casualty side, carriers are still wrapping their arms around bitcoin mining exposures but are comfortable providing coverage if exclusions are added for professional and cyber liability.
The U.S. government has talked about monitoring/regulating bitcoin, but nothing material is yet in place. Whenever there are public statements, however, the value of bitcoin/crypto sees a dip, which could impact an insured’s projected income.
London and Bermuda
In Bermuda, capacity has developed with new and existing carriers for different aspects of crypto exposure.
The principal insurance focus has been on the professional lines needs of both crypto companies and the service providers to the crypto market. D&O and tech E&O/cyber coverages are available with line sizes of $2 million to $10 million from several carriers.
General liability (GL) cover is also available but more limited due to the small size of most risks. Primary GL with up to $5 million in limit is possible.
Property cover for all classes of risk, especially miners, is available in primary and excess, with $10 million to $40 million limit available depending on the risk. There is some limited BI
capacity, however, given the difficulty of measuring this exposure, each case will be evaluated on its own merits. Other lines such as crime can also be considered.
In London, we are seeing more caution from underwriters following FTX’s collapse, including heightened scrutiny and a demand for transparency from crypto companies about their exposure to FTX. Exposed companies are seeing exclusionary language applied or the risk is being declined altogether.
Be on the Lookout
It’s important for retailers to partner with a wholesale broker who understands the crypto/bitcoin space and can tailor policy terms to help the carrier get comfortable with the risk. Some market-specific applications can be provided to help target the information required by underwriters.
Comprehensive and well-structured submissions are essential. For professional lines and crime, it’s important to provide full details. It’s also key for retailers to outline the risk management steps insureds are taking to prevent fires, etc.
Insights provided by:
- Alan Waring – Non-executive chairman with Amwins Bermuda
- Linsey Neuhard – Vice President with Amwins Brokerage in New York, NY
- Patrick Park – Vice President, Amwins Brokerage in Woodland Hills, CA
- Oli Doran and David Taylor – Amwins Global Risks

Cyber
Overall Segment Trends
Given the impossibly hard cyber market for the past two years, it seems almost inconceivable that we could experience any market softening… and yet, here we stand on a plateau of sorts.
Make no mistake, this plateau is still rock hard, but most “shock” pricing adjustments have already happened and pricing across most industry classes seems to have stabilized. We suspect the rightsizing of network security controls mandated by carriers over the last 18 months is beginning to have a positive impact on loss ratios.
In the early days of the war in Ukraine, there were fears that cyber-attacks launched by Russia could cause collateral damage for insured businesses. Those concerns have not necessarily developed into a problem. There are vendors and underwriters with concerns that hackers distracted or displaced by the war will eventually come back online and drive ransomware attacks back up.
As ransomware events have slowed down (theoretically from better controls), social engineering losses never went away and are among the loss leaders again for cyber insurance.
Pricing and Capacity
Rates now seem to be contingent on historical rating factors, such as revenues and claims, rather than market trends. Max increases are around 20% to 30% on primary. However, it’s now common to see flat rates for insureds with strong or improved controls.
Most underwriters are still capping capacity at $5 million, but we are starting to see more $10 million limits, and higher excess markets are starting to drop down to lower layers. New entrants offering excess to companies in the $1 billion+ revenue space will need to compete with standard markets becoming more comfortable offering higher capacity.
Within the small- to medium-sized enterprises (SME) space, new markets/insurtechs are promoting cyber security in addition to underwriting efficiency.
Challenged Classes
Carriers are carefully picking where to cull industry classes from their book of business.
Classes like Managed Service Providers (MSP), municipalities, crypto and cannabis remain higher hazard classes, but we are also seeing pressure on businesses previously perceived as favorable.
For example, in years past, accounts with high revenue and low personal identifiable information (PII) stored on systems were discounted by underwriters due to the perception that data breach exposures were limited.
With ransomware attacks boiling over, however, the first-party business continuity insuring agreements were paying the majority of losses on these accounts. So, carriers are making pricing adjustments in these verticals that are more aggressive than in years past.
Limitations and Exclusions
Carriers are excluding issues that arise because of a “failure to patch” known security risks and requiring insureds to monitor the Common Vulnerabilities and Exposures (CVE) database of publicly disclosed information about security issues. Insureds should be on the lookout for vulnerabilities (especially those with a severity score between 8-10) that impact their systems.
For systemic risks, meaning the potential for a single event to cause massive disruption within a country, industry, or across a broad spectrum of users, we are seeing mostly sublimits applied, though some carriers are using co-insurance and others offering the ability to “buy back” this coverage.
Several class action lawsuits have been recently filed alleging violations of various regulations based on companies’ usage of pixel tracking and subsequent sharing with the likes of Meta, Google, and others for purposes of targeted advertising. The most affected sector is Healthcare given the potential for HIPAA violations. The issue is that once the information is shared, the “breach” is considered to have already happened. So even if unsuspecting marketing departments turn off this feature when notified, there’s potential for liability to still exist. Due to the nature of the risk, massive loss potential, and the possibility to bleed into D&O, many cyber carriers are adding sweeping exclusions to preclude cover for these types of losses.
Carriers are concerned that warlike actions, which are generally excluded from coverage, are moving from purely kinetic to a digital form. Lloyd’s is adding war/terrorism exclusions to its syndicates’ cyber policies and/or endorsing policies to specifically outline how coverage would apply in such a scenario – if at all.
Regulatory restrictions on paying ransomware have become a topic of conversation but unlikely to change overall industry coverage due to potential ethical conflicts in the event of catastrophic events.
Tech E&O
We are still seeing strong contractual requirements for specific limits even for the smallest insureds. In these instances, it’s difficult to come by the needed capacity and often we must piece it together in layers.
Additionally, we are seeing a lot of overlap between tech/MPL/cyber exposures. As our society relies more on technology to accomplish tasks and support businesses, the lines between where liability falls continue to blur. Comprehensive insurance solutions with amenable “other insurance” provisions are extremely important.
Be on the Lookout
Multi-factor authentication (MFA) remains a sticking point for carriers. Tougher industry classes and higher revenue companies are expected to have multi-factor authentication deployed on all e-mail, remote access, privileged/admin accounts, and cloud backups access. Renewals that come around with little-to-no progress on mandated network security controls will face steep pricing increases, if they are able to obtain coverage at all.
More carriers are also beginning to dig further into the number and type of service accounts within the domain administrator group. Typically, a low number is better, but certain zero-trust environments can utilize a high volume of segmented service accounts as a best practice. Larger insureds facing this level of underwriting scrutiny need to make sure their IT departments (and/or vendors) are ready to respond quickly to questions as they are posed throughout the underwriting process.
Insights provided by:
- Charlie Grodecki – EVP with Amwins Brokerage in Charlotte, NC
- Marc Lysse – VP with Amwins Brokerage in Atlanta, GA
- Matt Donovan – SVP with Amwins Brokerage in Atlanta, GA
- Megan North – EVP with Amwins Brokerage in Seattle, WA

MGA Marketplace
Growth and Market Interest
Growth in the MGA market has been expanding faster than the market itself. This is due in part to carriers and reinsurers who are beginning to take a more delegated authority approach to penetrate the market. Additionally, from a property and casualty perspective, we are seeing more non-traditional entities getting into the MGA space, as well as insurance linked securities. Provided that underwriting results remain positive, we expect this upward growth trajectory to continue.
The expanding MGA market has also been buoyed by the abundance of underwriting talent that has become increasingly frustrated with the lack of flexibility from traditional P&C carriers. This has created a movement where more underwriters are interested in assuming entrepreneurial roles and thus, are moving into the MGA space.
Challenges
With new growth comes new challenges – particularly in the recruitment of top industry underwriting talent in the MGA space.
Capacity challenges also impact the space – specifically in the property natural catastrophe (nat CAT) market. The continued dislocation of the property market has created a growing demand for insurers and reinsurers to get CAT risks off their balance sheets.
A Strong MGA Model Moving Forward
Accounting for an estimated $70 billion in annual premium, MGA-sourced business is not far behind the premium volume written in the total E&S market¹, making the trend toward rating MGAs a positive change for the industry. As long as the MGA market continues to demonstrate discipline, produce favorable underwriting results, and (most importantly) protect the capital of its partners, this insurance model will remain strong.
Last year, Amwins underwriting outpaced the MGA industry and broader P&C market in terms of GWP growth by 21.6%². To address the issue of recruitment in the MGA space, Amwins has created a unique incubator platform that is attractive to underwriters who are looking to take an entrepreneurial approach to their careers.
- Mark Bernacki - CUO, Amwins
- Bob Petrilli - President, Amwins Underwriting
¹2022 Conning Report
²2022 Conning Report

 Expertise
