
Catastrophe (CAT) modeling provides a statistical and financial analysis of a property’s exposure to catastrophic events. It is a tool to help guide underwriters, brokers and the insured in coverage decision making and pricing. But before we dive into what’s new in CAT modeling, let’s look at just what CAT models are and why they’re so important.
What is CAT modeling?
CAT modeling is a detailed analysis tool that uses mathematical models and simulations to assess the potential impact of natural or man-made disasters in a specific area. These models analyze data that account for varying geography, building structures, and past disaster occurrences to estimate potential losses and damages from future potential events. Damage estimates are given in two ways:
- Probable Maximum Loss (PML): the potential loss to occur at a property. For insurance purposes, a 250- or 500-year timeframe is used to represent the potential loss from an event that could occur once every 250 or 500 years for a property with its characteristics, location and TIV.
- Average Annual Loss (AAL): the “average” amount of loss in a given year from catastrophic events. We know there is no “average” catastrophe so really the AAL provides a long-term view of the exposure to catastrophic loss and the annual funding for such losses.
These models are used by a number of professionals in our industry: insurance companies, rating agencies, retailers, wholesale brokers, reinsurance companies, risk managers and state regulatory boards, to name a few.
Why is it needed?
As the name implies, CAT modeling is best used on accounts with exposure to CAT perils, such as wind, quake, tornado-hail, wildfire or inland flooding. It helps insurers, businesses and public entities make informed decisions about risk management, insurance pricing, disaster preparedness and investment strategies.
CAT modeling is best used on accounts with exposure to CAT perils, such as wind, quake, tornado-hail, wildfire or inland flooding.
Additionally, CAT modeling results can be used to illustrate potential damage from non-historic events (those that haven’t happened but could) and spotlight locations that are driving catastrophe loss numbers.
CAT modeling helps us understand catastrophe pricing adequacy of individual risks while helping insurers plan for adequate reserves and financial solvency which is key when estimating pricing for the catastrophe portion of an account.
How does it work?
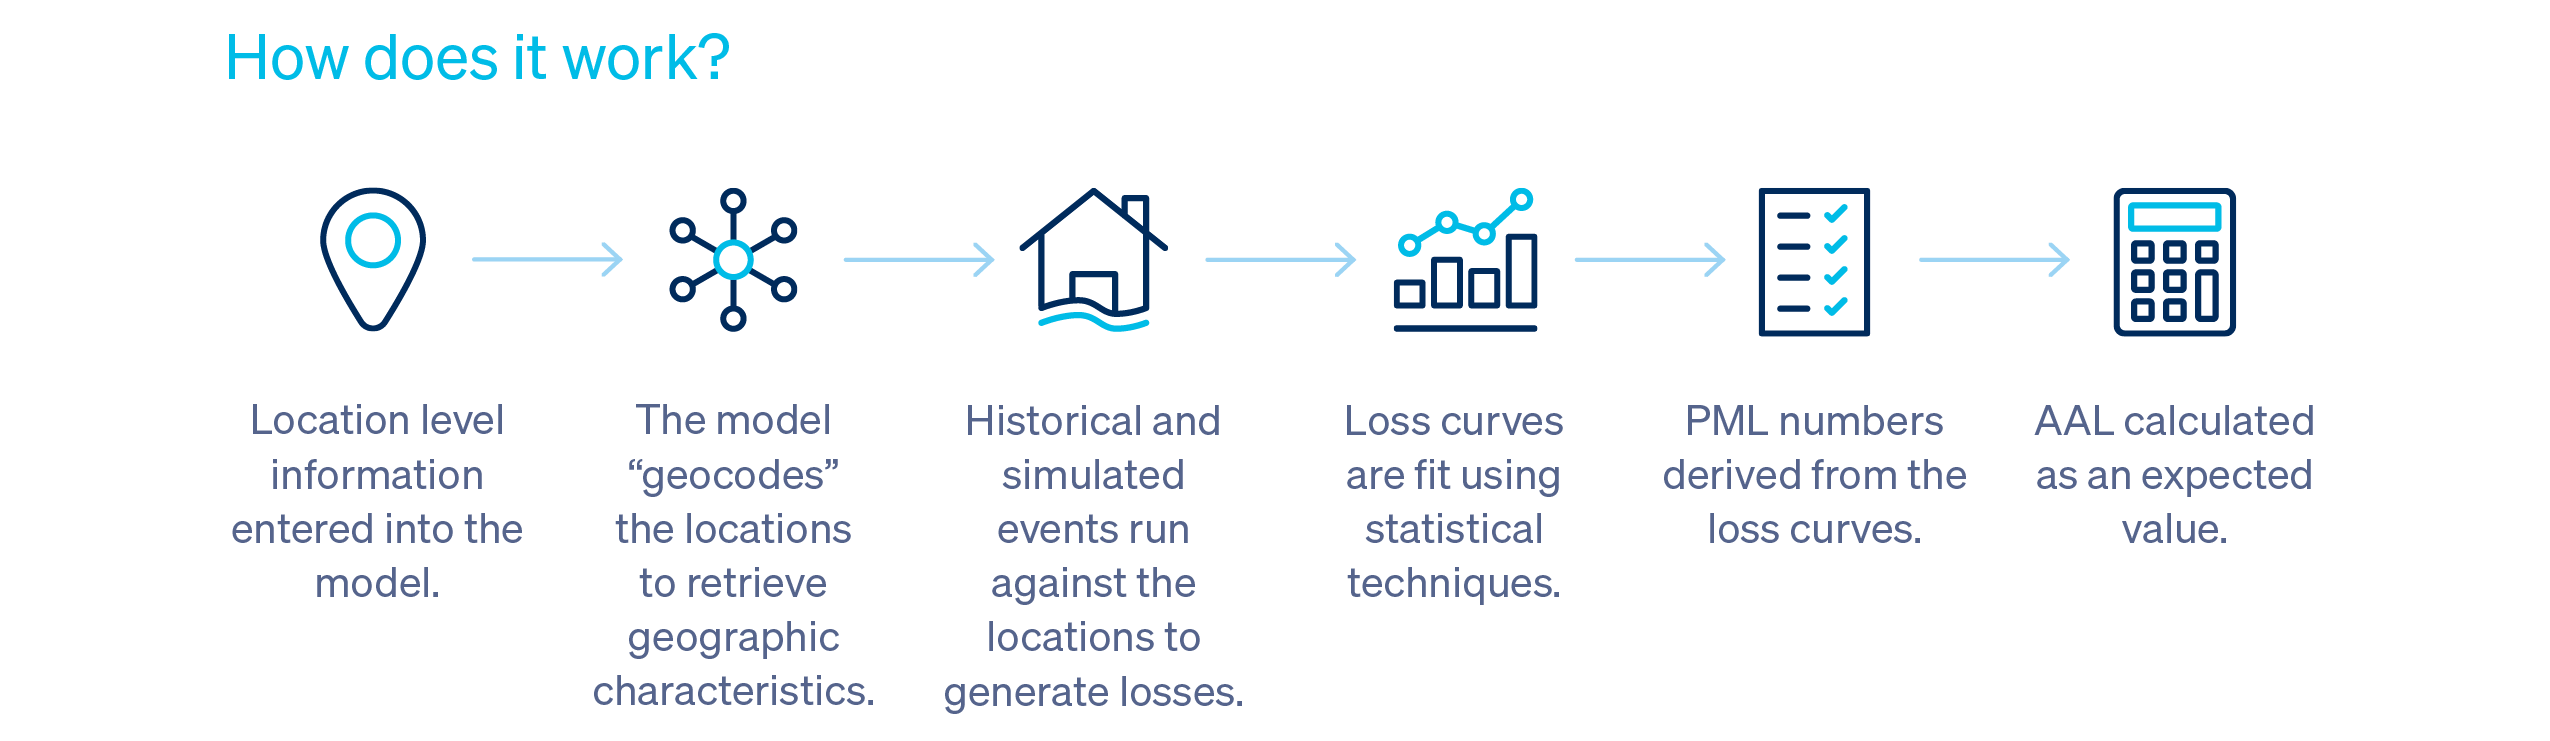
A lot of information goes into building these models, including but not limited to historic loss data, magnitude and ground shaking for historic earthquakes, central pressure and wind speeds for historic hurricanes, as well as new research on loss propensity by construction and occupancy type.
So, what’s new?
There have been significant updates in RMS version 23, particularly for the North Atlantic Hurricane Model. While version 23 has been out for a while, markets have only recently begun to make the switch. Key changes include:
- Updated vulnerability curves: These reflect insights from claims analyses related to hurricanes Irma and Michael, impacting commercial risks and condo HOA occupancies.
- Wind-driven rain impacts: Enhanced modeling for multi-family dwellings, hotels, schools and restaurants is noted as a major improvement.
- Rate updates: Medium and long-term rates have been updated based on recent activity, with new bands for buildings constructed in 2021 and beyond, reflecting the updated Florida Building Code.
The impact of these model changes varies widely, with increases in hurricane risk assessments ranging anywhere from 5% to 50% based on specific exposures. Personal lines showed less impact compared to multi-family dwellings, particularly in high-risk areas like Texas and Florida.
Knowing what version of RMS your market is utilizing can help manage client expectations effectively.
Knowing what version of RMS your market is utilizing can help manage client expectations effectively, as you will be able to compare and understand rating changes. Models will continue to be updated over time and Amwins will keep you informed as new information becomes available.
We help you win: Amwins’ in-house modeling team
Amwins has an in-house modeling team that utilizes RMS (Risk Management Solutions) and AIR Worldwide (a division of Verisk Analytics) to produce a variety of reports, including but not limited to:
- U.S. Hurricane Reports: These reports include PMLs (Probable Maximum Loss), AALs (Average Annual Loss) and standard deviation metrics, with considerations for storm surge and demand surge impacts.
- U.S. Earthquake Reports: Metrics similar to those shown above are provided, with additional considerations for fire following and demand surge.
- Severe Thunderstorm Reports: These reports also include PMLs and AALs, addressing tornado and hail risks.
- Flood and Wildfire Reports: Inland flooding and wildfires in the western states are included in these reports, with similar metrics and considerations for demand surge.
- Caribbean and Mexico Reports: Earthquake and hurricane reports for these regions are also generated, focusing on PMLs and AALs.
Talk to your Amwins broker to learn more about our CAT modeling capabilities and how they can help you find the right solution for your clients.