Although the market remains unsettled coming into 2021, carriers are gaining a better understanding of the long-term implications the COVID-19 pandemic is having on claims experience, allowing for more confident predictions in some cases. However, there are many other factors contributing to uncertainty and volatility as we look toward 2022.
State of the Stop Loss Market
Welcome to the 2021 Q1-Q2 Stealth Partner Group Stop Loss Market Update. The intent of this publication is to provide our partners with meaningful and actionable insights regarding emerging market trends.
The costs associated with providing a backstop to self-funded plans continued their upward trajectory as we entered 2021, and we expect that trend to continue to accelerate. In spite of these headwinds, over the past ten years the percentage of covered workers enrolled in self-funded plans has increased from 59% to 67%, which included a 6% increase from 2019 to 2020 - the largest single annual increase in over 20 years. As a result, the medical stop loss market grew from $12 billion at the end of 2014 to $24 billion at the close of 2019.3

As predicted in our Q3-Q4 2020 Market Update, aggregate claims remained suppressed due to COVID-19 restrictions. In fact, Stealth observed no aggregate hits for the 2020 calendar year. Several carriers predict the decrease in frequency of small specific claims is a trend that will persist throughout the remainder of 2021, while others believe an increase in specific claims will be realized in 2021 due to delayed testing and treatment. These carriers feel that if this increase in the frequency and severity of large claims goes unmanaged, it will serve as a harbinger of volatility and uncertainty for years to come. As a result, pricing for stop loss moving forward will vary greatly by market.
There is the additional fear that although hospital systems, facilities, and physicians lost significant revenue over the past year and a half, their expenses were not reduced in kind. As a result of this imbalance, providers will be forced to negotiate higher prices, resulting in additional inflationary pressure on claims expense.
Due to deferred screenings and care, cardiac diagnoses are expected to increase in 2021, with an 18% increase in ischemic heart disease and a 14% increase in congestive heart disease.
The statistics quoted above are just two of the many anticipated increases forecast by the Prealize 2021 State of Health predictive report. Other notable 2021 predictions included anticipated increases of 23% in cancer diagnoses and a staggering 112% increase in fractures during the same period. “Postponed elective orthopedic procedures such as hip and knee replacements will be a key driver of increased fractures in 2021”. In 2020, many carriers were able to avoid significant payouts on aggregate claims. However, this year, those same carriers are pointing to these predictions to justify conservative rate and renewal terms1.
A Global Medical Trend Rate Report released in October of 2020 also forecast that:
“The cost of employer medical benefits across the world will fall to 7.2% in 2021 from 8% in 2020. However, this still outpaces general inflation by 5.0%.”
While the level of uncertainty surrounding COVID-19 has not lessened in relation to the impact on long-term healthcare, most market studies share the expectation that medical plan utilization will return to normal levels as availability of elective procedures begin to ramp back up throughout 2021.
In the early stages of the pandemic, it was easy to predict that the fallout would be two-sided... while COVID-19 related costs would most likely increase as cases around the United States began to surge, there would also be a decrease in non-COVID-19 charges due to deferred or postponed non-emergency care.
“By April 2020, stay-at-home orders had led to a 52% reduction in outpatient facility allowed claims relative to the year prior.”2
This unprecedented imbalance of utilization meant that actuaries have had to rely on deferred cost assumptions more than almost any other period in modern medicine. As mentioned earlier, this approach has led to anticipated conservative renewals, increases in the presence of lasers, leveraged trend assumptions and preparation for increased utilization. Carriers are preparing for large claims... and we are here to help you do the same.
By leveraging our extensive book of business and strong carrier relationships, Stealth is able to provide our clients with the knowledge and experience necessary to place their business in the best-suited hands.
The charts on the following pages represent a year over year look back at data responses to a variety of our most frequently asked questions.
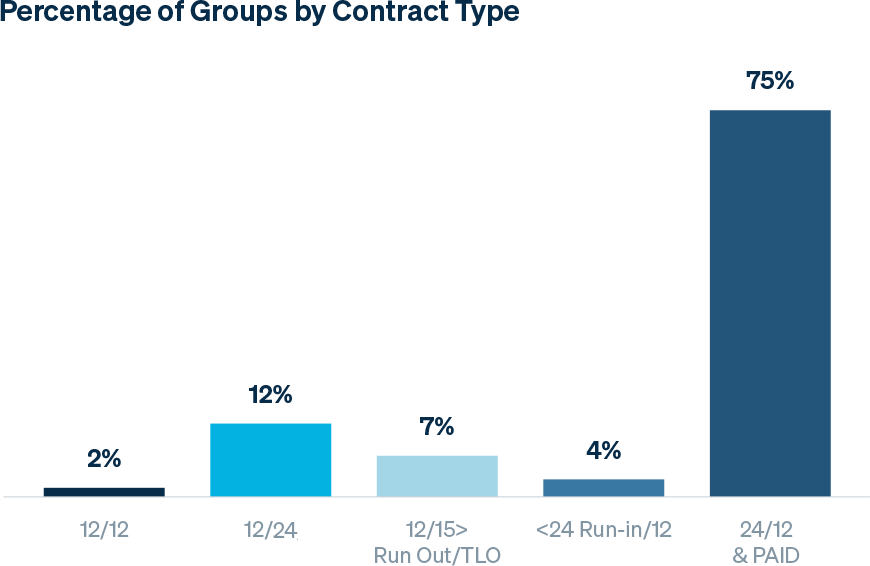
Premium and Contract Types
As noted in the graph below, paid contracts greatly outweigh incurred contracts; these contracts are typically attributed to more mature groups which require continuation in coverage without gaps.
-3-year-look-back.png?Status=Master&sfvrsn=e806a589_1)
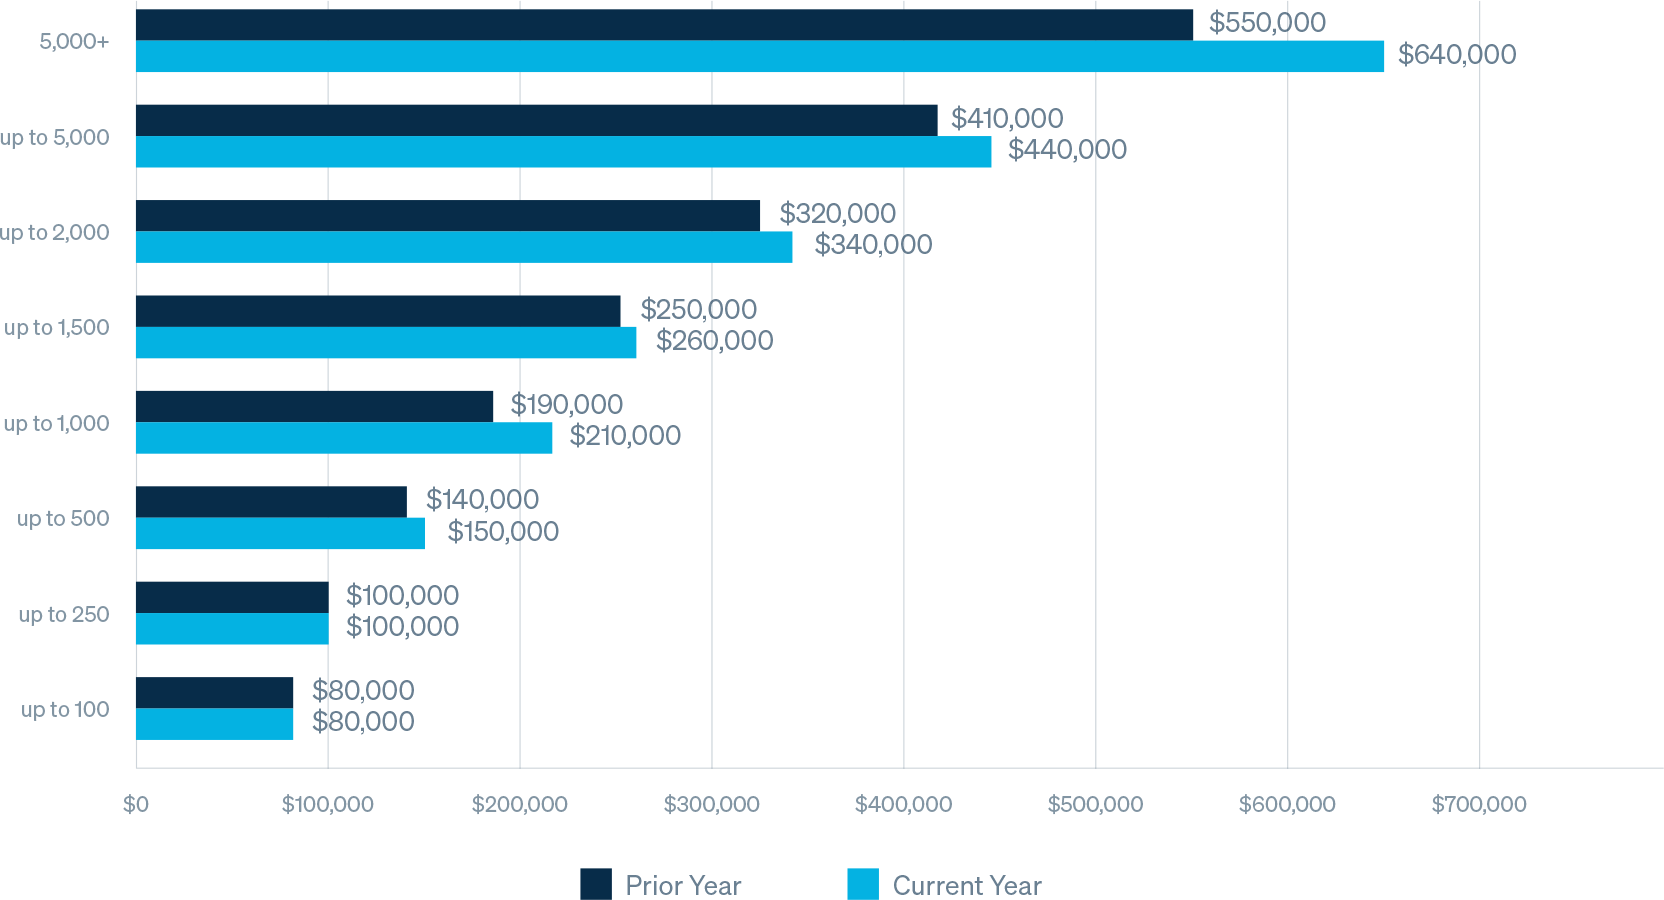
* Note: these amounts are not normalized for market, and reflect changes in book of business, employer size, deductible, and / or lasers, etc.
Average Specific Deductible by Group Size
Average deductible for groups with more than 250 employees is increasing on average in high, single digits.
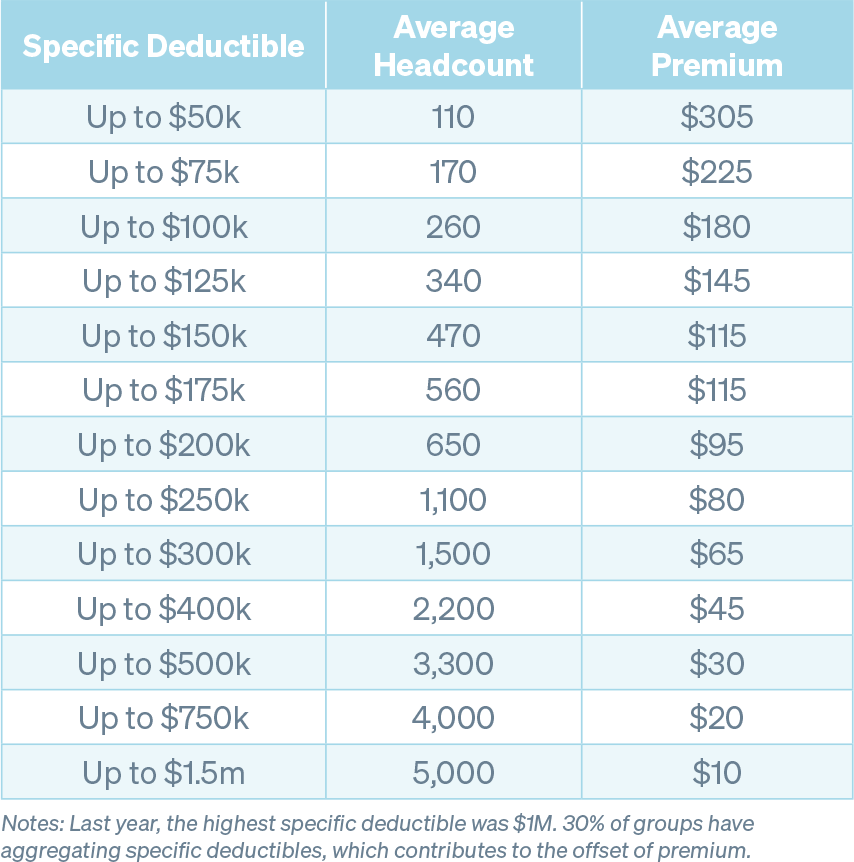
Average Premium and Headcount by Deductible
It is customary to see specific deductibles increase in relation to the size of the group. It is also worth noting that year over year, the average number of employees by deductible is decreasing, resulting in groups taking on more risk on a per employee basis.
We have observed that a number of groups that were previously bare are now purchasing high level stop loss policies. This is likely the result of the perception of increased risk and uncertainty associated with high dollar cost gene therapy and specialty drug treatments forecasted to enter the market.
The premium amounts below, while representative at a high level of Stealth’s book of business, should not be used for benchmarking purposes without additional consideration. Contract terms will vary due to the presence (or absence of) features such as aggregate coverage, aggregating specific deductibles, lasers, no new laser provisions, renewal rate caps, and cost-containment and/or carve-out provisions. Additionally, specific markets, group size, contract type, claims history and other demographic data ultimately informs final premium rates.
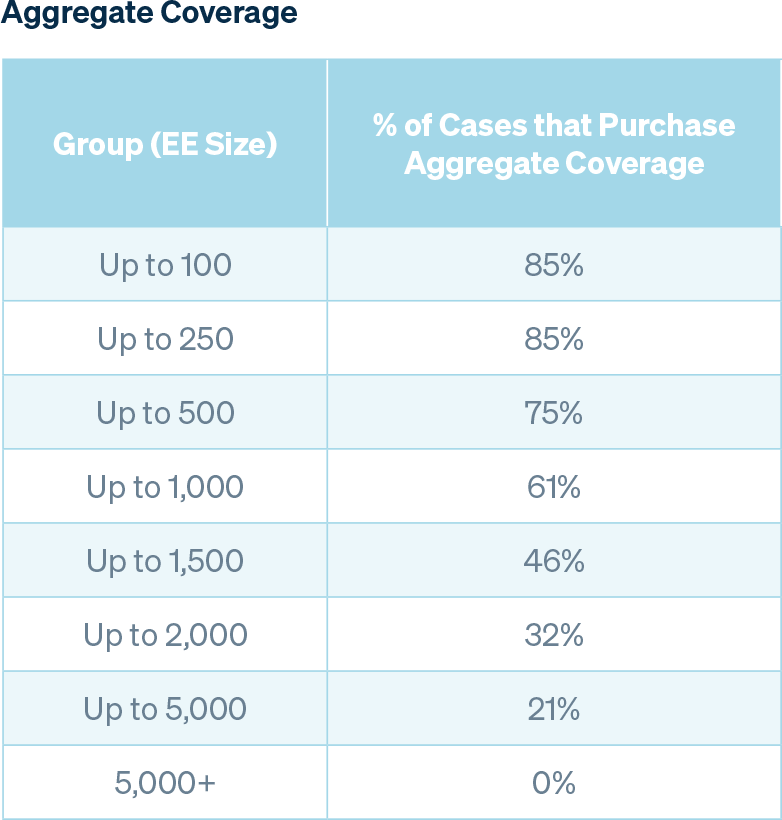
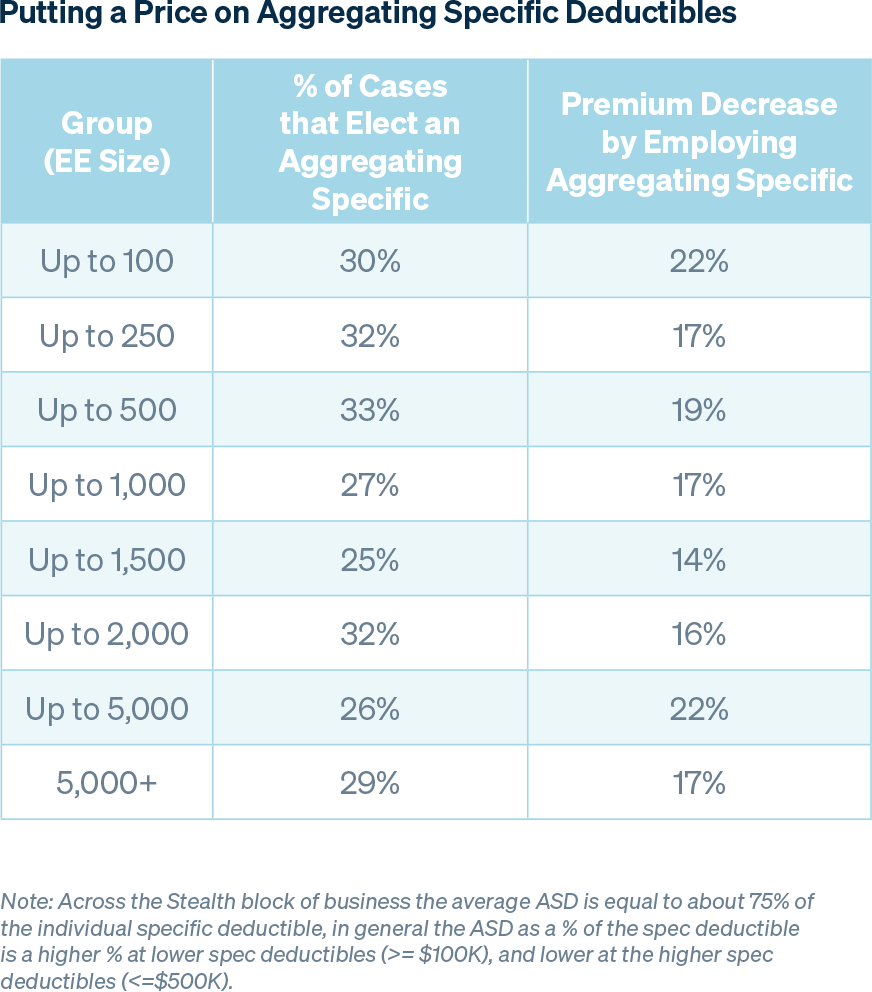
As the number of employees in a group increases, so does overall claims predictability, therefore a group may be willing to forgo aggregate coverage, which is consistent with the trends noted in the table below. The percentage of groups with aggregating specific deductibles remains relatively stable regardless of group size, and the average premium decrease is also consistent across the board.
Laser
34% of our block of business currently has lasers applied to individuals. The average number of lasers per group is 1.9 in that cohort, which has not changed materially since last year.
Summary
Understanding the market, preparing quality submissions that clearly tell the story of the client organization and choosing experienced partners are keys to placing business in this hardening market.
There is still an abundance of capital flowing into the healthcare arena supporting new entries and health mergers and acquisitions activity. We are seeing new cost containment vendors, PBMs, MGUs and TPAs enter the market. This investment is trickling down to the stop loss markets, and that excess capital that carriers are trying to put to work may be holding rates down while costs are trending higher. We believe this is why we are seeing many cases with favorable experience getting below leveraged trend increases at renewal. This does contrast with others that have expected, or worse than expected, claims experience getting very large rate increases. During a time of uncertainty and volatility coupled with new market entrants and unproven solutions, it is critical to align with an experienced and trusted partner.
Stealth Partner Group is a proven market innovator with deep carrier relationships that we use to help our clients. It is our commitment to our broker and consultant partners that drives our team’s desire to fulfill our shared goals.
Sources
1 Prealize 2021 State of Health Predictive Report
2 AON Global Medical Trend Rate Report
3 Kaiser Family Foundation 2020 Health Benefits Survey