
Looking ahead to 2026, understanding the complexities of our dynamic market continues to be demanding. Some sectors are experiencing favorable rate movement and improved underwriting results, while others still face tougher challenges.
This State of the Market report features expert insights from Amwins professionals into the elements influencing these trends. It examines rate movements, capacity and evolving coverage across various industries, business lines and risk specialties in the United States, London and Bermuda.
Rather than simply forecasting trends, we aim to maintain our promise to you. With over $45 billion in premium placements, more than 100 underwriting programs and global reach, our skilled teams of brokers and underwriters have the full support and resources of our firm to give you a clear advantage.
We remain dedicated to delivering outstanding placement and service in any market environment, helping you successfully navigate both current and emerging industry challenges.
We help you win!
![]()
Property
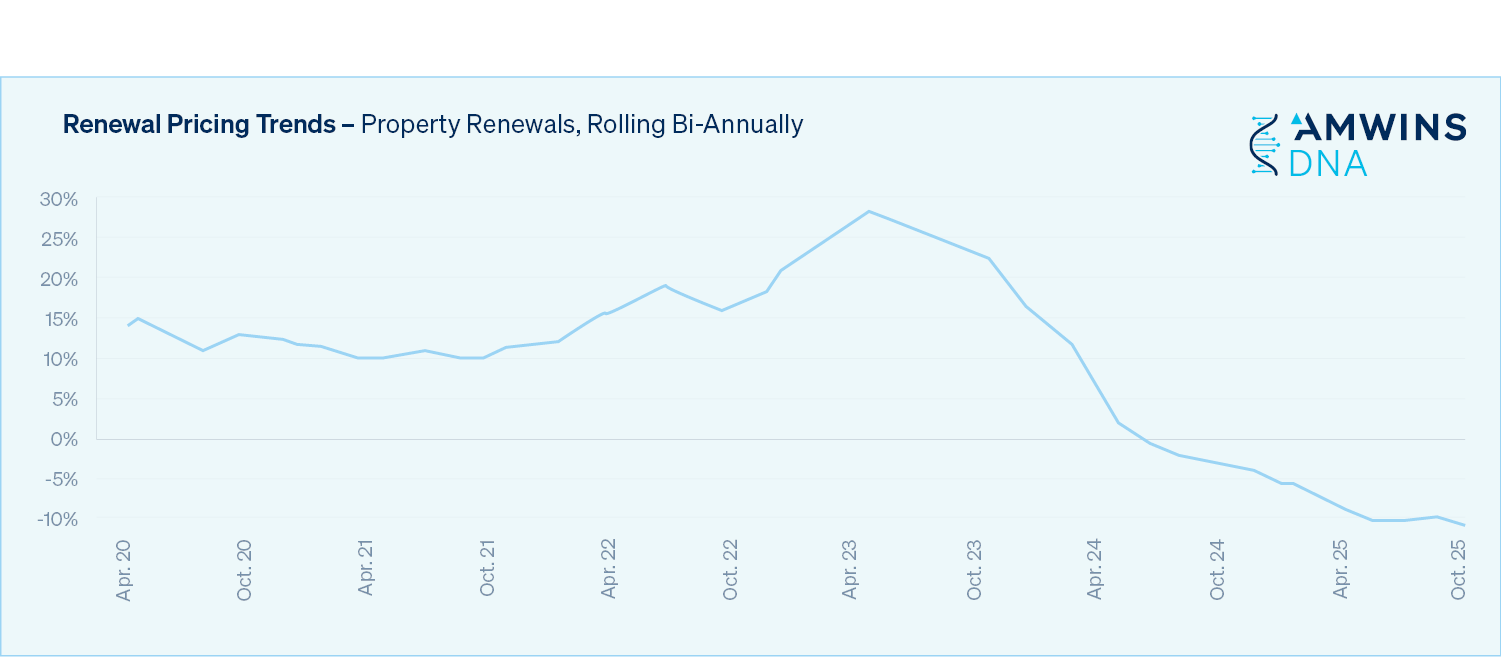
The property marketplace remains extremely competitive heading into 2026 for a variety of reasons, including but not limited to the following:
- Record availability of capacity from existing carriers, MGAs and syndicates, as well as a near continuous flow of new entrants, provides an ongoing opportunity for knowledgeable brokers to achieve rate reduction and coverage improvements. (Increased capacity is directly proportional to increased competition.)
- Rate reductions in 2025 commonly ranged from high single digits to 25%+, depending on account specifics.
- Coverage improvements may include reduced deductibles, improved terms and conditions, a broader policy form, minimization of non-concurrencies, removal or loosening of restrictive wording and warranties, etc.
- No less than six new domestic property carriers/MGAs are slated to open in 2026, in addition to seven new syndicates within Lloyd’s and six new Bermuda property operations.
- In 2026, Lloyd’s aggregate stamp capacity is projected to increase by 4%.
- Line size expansion from the majority of domestic carriers and MGAs, as well as Lloyd’s of London is also expected.
- Substantial oversubscription within layered/shared placements is commonplace, applying downward pricing pressure on all layers within a placement. For single carrier placements, incumbent carriers are often challenged by non-incumbents.
- Carriers and MGAs are highly focused on account retention and generating premium growth as most management teams have budgeted for growth rather than shrinkage.
- Despite the devastating Los Angeles wildfires in January 2025, as well as other meaningful losses throughout the year, overall property losses in 2025 were very manageable given overall carrier capitalization.
- Nearly all carriers, MGAs and syndicates are likely to be profitable in 2025, making it a three consecutive year run of profitability.
- Double-digit cost reductions are projected for 2026 treaty reinsurance renewals, with the possibility of select carriers securing lower attachment points from their treaty reinsurers.
Billion-dollar claims and SCS activity
Through June 2025, the U.S. had already endured 14 separate billion-dollar weather and climate disasters, according to Climate Central. Despite the scale of these events, re/insurers took them in stride.
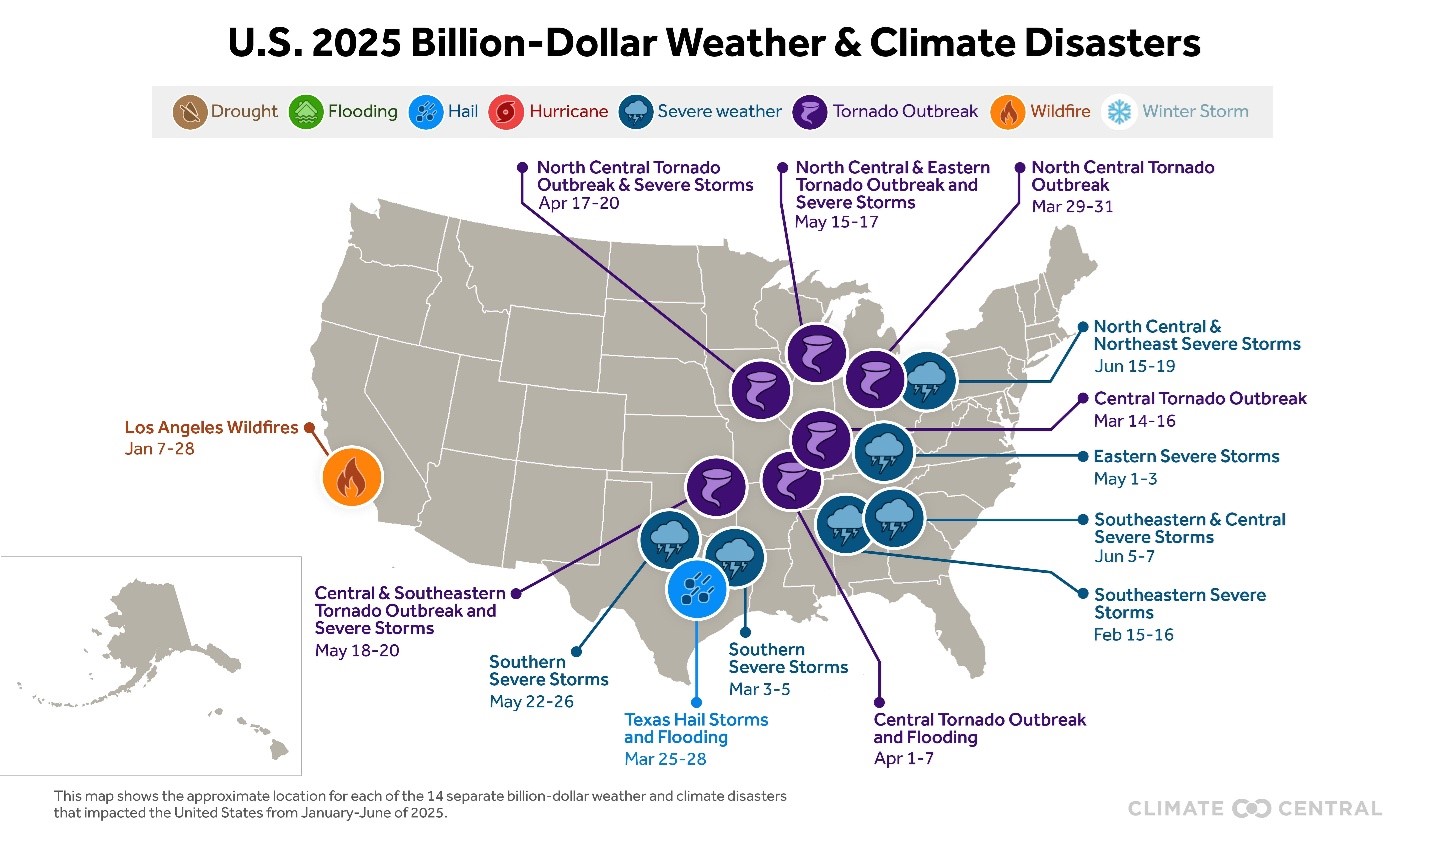
Recent catastrophes have caused only modest ripples in treaty structures. Capacity continues to expand, demand has held steady and for now, the market seems well equipped to absorb losses. However, that balance is delicate. A sudden shift—whether from tightening capacity or rising demand—could quickly magnify the financial impact of future disasters.
For the moment, the numbers tell a story of resilience. The U.S. P&C industry posted a combined ratio of just 89.1% in Q3 2025 (the best result in a decade) driven by strong reserve releases and a relatively mild catastrophe season.
Hurricane
For the first time in a decade, no hurricanes made landfall in the U.S. which was remarkable considering the conditions: sea surface temperatures were warmer than average and with the return of La Niña, meteorologists anticipated another active hurricane season.
The season saw several major storms, including three that reached Category 5 strength (Erin, Humberto and Melissa). Yet, according to a recent Bluesky post, a persistent trough of low pressure created favorable steering currents that pushed the most powerful storms safely out to sea.
The U.S. didn’t emerge entirely unscathed. Heavy rains and storm surge associated with these distant systems caused millions of dollars in localized damage. For most carriers, these losses remained well within acceptable limits. When combined with the relatively moderate impact of the 2024 hurricane season—largely viewed as an “earnings event” rather than a capital event—continued downward pressure on rates has followed.
Severe Convective Storm
By September 2025, insured losses from U.S. severe convective storms (SCS) had already reached an estimated $42B, marking a “new normal” with average per‑event costs roughly 31% higher than the previous decade. Since 2020, SCS losses have surpassed those from hurricanes, forcing insurers to rethink how they measure, price and manage this rapidly evolving risk.
As storm intensity and frequency continue to climb, collaboration between carriers and policyholders is increasingly critical. Encouraging and implementing more effective, sustainable mitigation practices can help reduce both exposure and vulnerability to SCS events. For added balance sheet protection, insurers and insureds alike should consider tools such as deductible buydowns to manage volatility and preserve capital strength.
Wildfire
Before 2015, wildfire-related insured losses represented approximately 1% of all natural catastrophe claims, according to Swiss Re. That share has grown sharply over the past decade, as eight of the 10 costliest wildfire events on record have occurred during this period. Today, wildfire losses account for roughly 7% of total insured catastrophe losses, a clear signal of how much the peril has escalated.
Despite this trend, insurance pricing has remained comparatively steady. Robust capacity from Lloyd’s and the domestic E&S markets has kept competition alive even as exposure increases. E&S carriers have played a crucial role in providing coverage in high-risk states such as California and Nevada, stepping in where admitted markets have tightened capacity or imposed high deductibles.
The result is a market that continues to adapt, balancing mounting risk with new underwriting approaches and an expanded appetite for complex wildfire exposure.
Market dynamics
Larger and larger stretch primary layers have grown in popularity over the past couple of years, sometimes eliminating buffer layers altogether or reducing the number of buffer layers that exist within a placement. In response to this, many carriers and MGAs that were exclusively buffer layer players in the past have adjusted their appetite to include primary layer participation and lower buffer layer attachment points. Similarly, certain excess layer players have adjusted their appetite to allow for lower attachment points and sometimes even primary layer participation.
Other key trends of note include:
- An increasing number of carriers and MGAs have begun to offer capacity in multiple layers, many times ventilated, as compared to offering just a single line.
- Carrier minimum premium, price-per-million and return on capital requirements are each experiencing downward pressure.
- Soft market conditions have led to very few classes of business and individual risk characteristics to be considered auto-declines.
- The percentage of accounts that now qualify for ground-up coverage from a single carrier/MGA is increasing.
Now is the time to work closely with your wholesaler to streamline programs and eliminate as much non-concurrency as possible within any given property placement. For example, many programs were split into pieces for a variety of reasons through 2023 during hard market conditions. The current marketplace may present the opportunity to recombine an insured’s assets into a master program.
Although reducing or meaningfully reducing the number of participants within a large layered/shared placement is achievable and even tempting in certain situations, maintaining continuity with long-standing program supporters, supporters that have paid large losses and supporters that have met with insureds over time is also very important to consider.
As carriers search for ways to grow in a shrinking marketplace, high-performing and well-managed MGAs are likely to receive additional PML for deployment in 2026 from existing panelists and new entrants.
Reinsurance treaties for 2026 are predicted to renew at double-digit rate decreases, pending no major losses for the remainder of the year. Whether it will be possible for reinsurance markets to maintain the higher attachment points they secured in in the past few years is yet to be determined.
As deductibles decrease, and to the extent there are then losses associated with the perils that received deductible decreases, we expect that claims frequency and carrier loss ratios will increase over time. As pricing simultaneously decreases, additional upward loss ratio pressure is experienced.
Should pricing levels dip to a point considered by carriers and MGAs to be below their technical price, carriers, MGAs and capital providers will begin to pass on opportunities and instead identify higher anticipated capital return options elsewhere. However, enough of the marketplace will need to take this step for the property marketplace to stabilize. And until then, or until there are one or more very substantial industry losses, or until carrier profitability no longer exists, the property market will continue in a downhill slide.
Strategic renewal approach
When meeting with insureds to review expiring property policies, plan for the upcoming renewal and review renewal options, it’s recommended to consider each of the following:
- Evaluation of the unique qualities of each opportunity: Every renewal and new business opportunity should be reviewed on its own merits as every account has its own history and unique risk characteristics as well as its own advantages and challenges.
- Up-to-date valuation review: Up-to-date valuations are critical in scheduled limits, margin clause and coinsurance scenarios. They can also help prevent a “double whammy effect” when the marketplace next hardens (i.e., rate increase due to market hardening + required upward valuation adjustment).
- Loss summary: Include detailed explanations of any sizable loss(es), as well as any steps taken to minimize the chances of similar losses going forward.
- High quality submissions: With submission flow at an all-time high, high quality and detailed submissions continue to be very important. Underwriters prioritize and favor detailed and well-organized submissions.
- Carrier meetings: For larger, complex and/or loss affected insureds, consider scheduling meetings with key incumbent carriers as well as potential key new carriers.
- Extensive review of quoted terms and conditions: Considering current market conditions, it’s important to ensure that the renewal program doesn’t contain unreasonable deductibles, sub-limits, exclusions/endorsements or risk mitigation requirements.
Strategic considerations
- As cost savings are achieved for your client, balance sheet protection can often be achieved via the purchase of AOP and/or named storm deductible buydowns, additional policy limits, larger named storm/flood/earthquake sublimits, parametric coverages, etc.
- Savvy clients should consider reinvesting premium savings into building improvements, right-sizing undervalued building valuations, right-sizing outdated business income figures, improved risk management, improved building security, etc.
- For undervalued accounts: While underwriters are still considering such opportunities given current market conditions, many of the most competitive primary layer carriers downwardly manage their line size.
- Well-managed and loss free accounts: These accounts continue to be treated more favorably than accounts with one or more challenges (undervaluation, losses, poor risk management, less desirable risk characteristics, etc.)
- With capacity abundant and oversubscription commonplace, insureds now have the luxury of prioritizing the signing of highly rated carriers with favorable long-term outlooks. However, in times of market softening, it can be tempting to minimize the number of carriers utilized in a carrier panel. Give consideration to maintaining a broad/diverse carrier panel (i.e., carrier loyalty), as this approach will pay dividends when the marketplace once again hardens or as large losses are sustained by an insured.
London
The London property market has seen additional new capacity, adequate margin and possible reinsurance premium relief as we enter 2026 – generating further softening. These changes are being felt across all areas of the market, with both CAT and non-CAT-exposed accounts seeing rate reductions and a softening in terms. Additional key items of note include:
- Rate reductions mimic what we are seeing in the U.S. market with some U.K./European carriers being as aggressive as U.S. markets on business they wish to retain. Continued downward pressure on rates due to bountiful capacity and strong competition will begin to squeeze profitability.
- Increased capacity, including additional Lloyd’s syndicates and company markets offering U.S. style line sizes on larger primary layers (e.g., $50M and $100M primary layers) plus various company markets offering $100M+ line sizes, have meant that requests for additional limit have been received positively.
- Follow/tracker facilities have become increasingly available, which has positively impacted capacity and resulted in increased efficiencies when filling out programs. It is important to consider which follow/tracker facilities are long term, secure players.
- Push for additional benefits from carrier partners including credits for improved risk management systems
- Outside of treaty exclusions (i.e., communicable disease and cyber), controlled flexibility exists specific to terms and conditions.
- Inflation is still a factor and above average in many areas. Insureds should be able to demonstrate confidence in valuations as rising costs can impact material costs.
- The U.K./European market is able to compete with U.S. carriers on smaller/middle market TIV accounts, illustrating that they believe this will be a core component of their portfolio going forward.
- Almost all types of business are still being considered, and there is no indication that new business activity is decreasing. London continues to be enthusiastic about maintaining its presence in the E&S market.
Amwins Global Risks offers two dedicated, exclusive facilities:
- Small business facility: Focused on TIVs less than $100M
- Middle markets facility: Focused on TIVs from $100M to $2B
These facilities are designed to expedite the process of gaining capacity, ensuring that you receive the most competitive pricing, terms and conditions available to your clients.
Bermuda
In 2026, no major shifts in appetite or line sizes are anticipated. The Bermuda property market, similar to the market in the U.S. and Lloyd’s, continues to soften. Terms and conditions continue to ease, with attachment points and deductibles slipping slightly, and carriers offering further rate reductions. There is also an ongoing focus on profitability and long-term partnerships.
Be on the lookout
- Actual treaty reinsurance results for January 1, 2026 renewals will be telling, foreshadowing upcoming 2026 treaty reinsurance renewal results.
- Each carrier and MGA we have spoken with are either in the midst of exploring AI use cases or already utilizing AI to increase efficiency. Submission ingestion and prioritization of opportunities are two commonly discussed potential uses of AI.
- Property accounts that weren’t aggressively marketed in 2025 by a retailer or wholesaler with full market access and true expertise in the space are almost certainly not optimized from a pricing and terms and conditions perspective.
- Accounts that are currently placed in the admitted marketplace may now be better suited for the E&S marketplace.
- Data centers are coming out of the ground at a record pace. Amwins brokers are experts at placing both the builder’s risk and permanent coverage for these unique and continually growing projects.
- In a softening property market, your chances of winning new business are meaningfully increased via careful wholesaler selection. Amwins brokers won a record amount of new business for our retailers in 2025, providing them with true competitive advantage and greater levels of success.
- Full market access is as important to your success as ever. This includes access to all of the following:
- New markets, MGAs, products and programs
- Limited distribution markets, MGAs, products and programs
- Exclusive capacity, products and programs
- London markets
- Bermuda markets
Insight provided by:
- Bob Black, EVP and Amwins National Property Practice Leader
- Kayla Bridgewater, VP, Property, Amwins Bermuda
- Steve Knight, Head of Open Market, North America, Amwins Global Risks
- Harry Tucker, EVP and Amwins National Property Practice Leader
- Jessica Zuiker, VP and Amwins Assistant National Property Practice Leader
![]()
Casualty
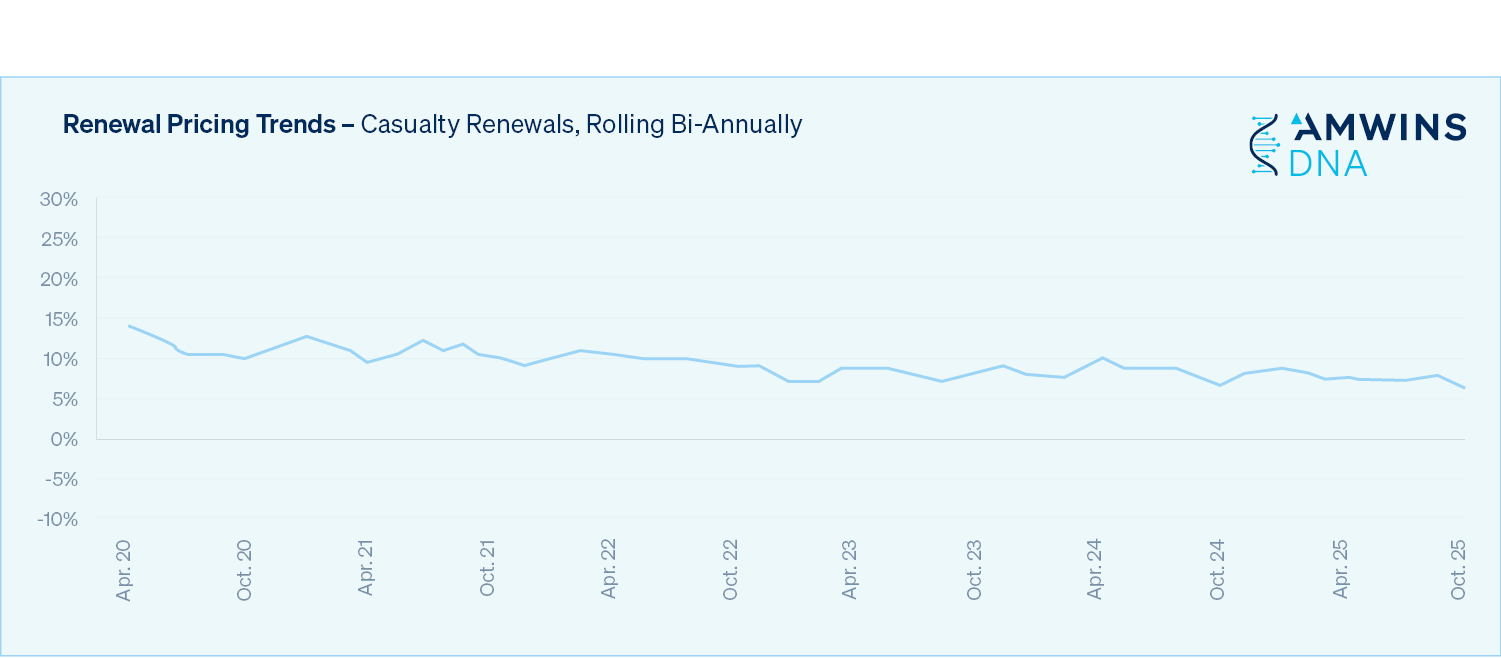
The casualty market in 2025 remained strong despite a modest slowdown in the second half of the year, likely due to economic uncertainty. New business growth continues to pace at double digits both in premium and submission volume. Carriers are still working to diversify their portfolios and capture market share – especially those willing to play in the tougher market segments.
Capacity and pricing
Additional capacity has tempered rate growth, with carriers targeting moderate increases in 2026 to keep up with loss trends. Middle market business ($25K to $100K premium) continues to be a focus and we anticipate this segment will remain competitive into the new year.
Many agree that the double-digit rate increases we saw in 2024 have slowed. Most accounts are seeing renewals that are either flat or in the single digits – especially in high excess layers – with the possible exception of large fleet exposures.
Similarly, while we’ve seen growth in primary GL policy count overall, new business (excluding projects/wraps) premium growth has moderated year-to-date. This suggests that insureds are increasingly willing to purchase more restrictive coverage or higher deductibles to lower premium.
Ongoing social inflation and rising claims have led carriers to examine their reserve strategy to help determine if they are well-positioned to meet current loss trends which are holding steady at 12% to 15%. Limits are not expanding, nor are they being cut. However, accounts with certain exposures like auto and SAM, remain challenging. There is continued skepticism that the casualty market has kept up with loss trends for post-2020 accident years.
Market dynamics
Regulatory & litigation trends
State legislatures across the Southeast are advancing tort reform aimed at reducing frivolous litigation, limiting nuclear verdicts and improving transparency around third-party litigation funding. Florida, Georgia and Louisiana have all passed significant legislation impacting bad faith law, premises liability, expert testimony and litigation financing, while South Carolina’s efforts remain under debate. These reforms are expected to reduce legal expenses, stabilize insurance markets and promote fairness, though their long-term impact will take time to measure as new laws are tested in court. You can read our full report on ongoing tort reform efforts here.
Technology & AI
As AI continues to advance, the way we work is changing. Carriers are in various stages of implementing AI into their underwriting workflows which will continue to transform the way in which business is transacted.
Strategic renewal approach
As the market fluctuates, it’s important insureds consider not only price, but a carrier’s financial strength and longevity, as well as their claims handling and long-term track record in the E&S space. Also, be sure to articulate and outline any nuances of certain risks and how they may outperform their peers, especially within tough industry classes.
When looking for additional capacity in a tightening space, considering quota sharing on excess layers is an option. Amwins’ exclusive excess casualty sidecar program offers a collaborative approach, enabling brokers to complete towers while maintaining consistency in terms, conditions and pricing across the shared layer.
London
Overall capacity has increased in London with four new market entrants in 2025. This has led to more business flow and a greater number of bound accounts.
Macro market trends have taken a back seat to industry sector trends. For example, auto and habitational casualty markets are seeing increased rates as capacity continues to retract and restrict terms in those sectors. Conversely, well-performing commercial construction accounts with no losses have begun to see some softening.
The number of MGAs continues to expand, likely a result of capital providers looking to deploy capacity through existing channels and share in the risk. At the same time, fast track/smart follow facilities are also on the rise, providing capital investors not only quick access to market but lower start-up costs.
Bermuda
The Bermuda market continues to provide a strong source of reliable, highly rated casualty capacity. In Q1 2026, there will be 22 casualty insurance markets trading in Bermuda, with two recent new entrants increasing overall capacity. With attachments from as low as $5M, there is now a wider array of capacity in Bermuda than ever before and Bermuda is gradually losing its reputation as a market of last resort.
Rates in Bermuda continue to be robust; we saw average rate increases in the single digit range during 2025. However, there is evidence that these increases are slowing and we expect that trend to continue in 2026. Nevertheless, tough classes such as transportation, public entity, heavy construction, energy and pharma/life sciences, as well as accounts with poor loss experience, can expect to see continued rate increases in the new year.
Markets in Bermuda continue to deploy capacity selectively. Average capacity deployed in 2025 ranged from $5M to $10M and that is expected to remain stable in 2026. Where pricing is very attractive and/or the attachment is high up in the tower, some markets have deployed capacity of $25M or even more. However, these situations tend to be more of an exception than the rule. Aggregate exposure continues to be a big focus and less capacity can be expected where a carrier has a potential exposure to the same loss from multiple clients (e.g., construction risks).
Interest in and demand for captives and other alternative risk transfer solutions, such as structured deals, is growing in Bermuda and is expected to continue – provided rates do not decline in 2026. Many clients have established captives or rent-a-captives as an alternative to guaranteed cost policies or to buy-down increased policy deductibles or fill coverage gaps in their programs. These clients are planning for the longer term where a creative ART solution can be tailored to work in both hard and soft markets.
Be on the lookout
- Many carriers are using AI to increase efficiency in their underwriting processes, utilizing the technology to identify submission opportunities and gather underwriting information prior to completing their review.
Insight provided by:
- Tom Dillon – EVP and Amwins National Casualty Practice Leader
- Tom Graham – Director, Casualty, Amwins Global Risks
- Alan Mooney – CEO, Amwins Bermuda
- Nate Schepers – VP and Amwins Assistant National Casualty Practice Leader
![]()
Professional Lines
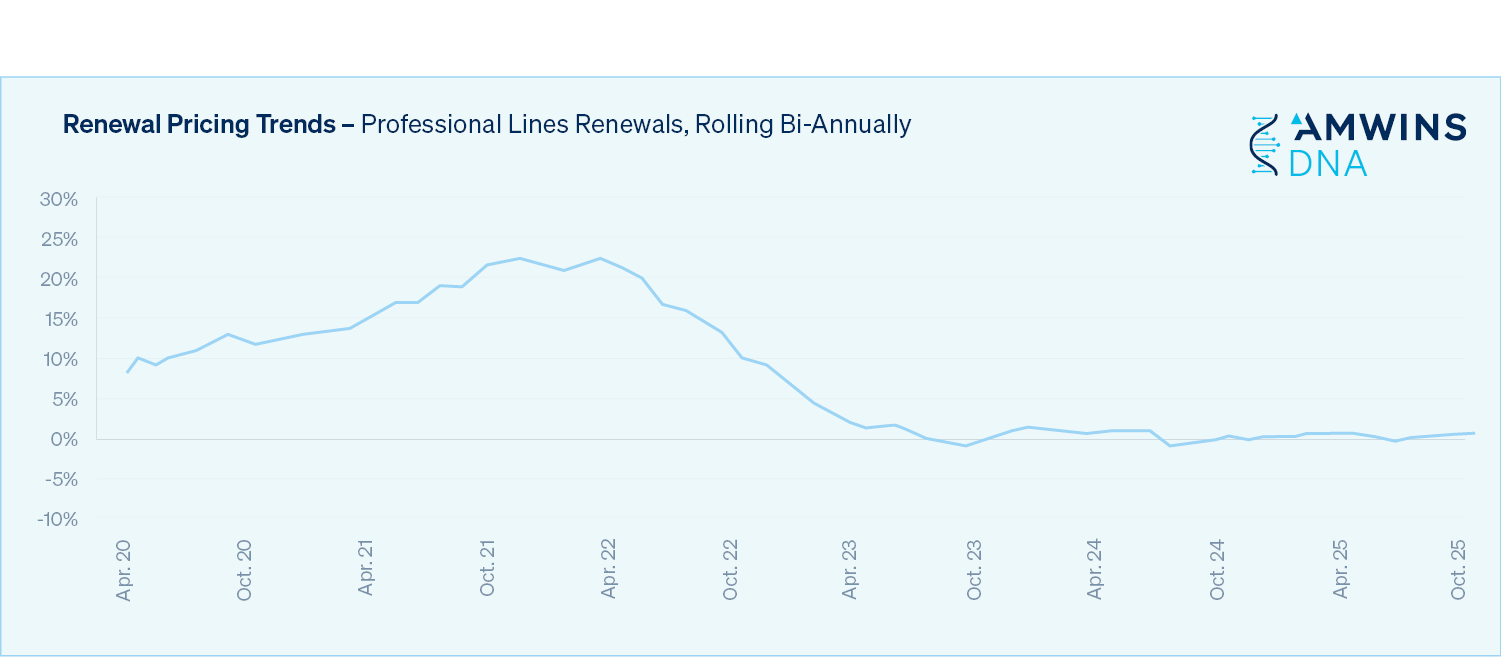
The professional lines market remains competitive. Policy count is up overall and there are still opportunities to be found. However, it’s important to remember that market cycles and fluctuations affect classes of business differently – and at different times. For example, where the D&O market remains favorable for buyers and is beginning to show early signs of stabilization, capacity remains constrained within the sexual abuse and molestation (SAM) marketplace. When talking to clients, ensure that they know what to expect at renewal.
Broad coverage and ease of doing business are fundamental to meaningful market growth. Carriers continue to stress the importance of relationships – they want to be seen as a long-term viable partner to insureds. And as such, they understand the need for speed in quoting risks and the fact that claims paying experience will factor into an insured’s decision.
Agents/Brokers
The Agents & Brokers E&O market enters 2026 driven by heightened competition and new market entrants. Both traditional carriers and an influx of MGA and insurtech programs are competing aggressively for small to mid-sized accounts, pushing pricing downward and expanding available capacity.
Carriers eager to retain business are offering broader coverage and favorable terms—including defense outside the limits, first-dollar defense, and aggregate retentions without maintenance clauses—often at no additional cost. Excess layers remain active but fragmented, with most carriers still capping participation at $5M due to severity concerns. Larger agents continue to face a limited pool of carriers, with more measured rate decreases.
The most meaningful coverage distinctions in the market continue to center on insolvency exclusions, defense provisions and aggregate retention structures. In certain states, insolvency exclusions are being more tightly scrutinized due to Fair Plan exposures, particularly in California and Florida.
Market dynamics
Regulatory & litigation trends
Despite the soft market, we continue to see claims related to coverage placement errors, clerical mistakes and failure to recommend appropriate coverage. In addition, social inflation and third-party litigation funding continue to elevate claim severity. Extended statutes of limitation for sexual abuse and misconduct claims, particularly against schools, nonprofits and youth organizations, are contributing to unexpected losses. These pressures persist even as rates continue to decline, underscoring the disconnect between pricing and long-tail exposure.
Technology & AI
AI is impacting the agent E&O landscape as carriers, MGAs and program administrators increasingly use AI in customer service, marketing and risk and policy analysis. This creates not only new efficiencies, but also new exposures. Agents employing AI-driven advice tools or outsourcing back-office functions face potential cybersecurity and data privacy risks, expanding what must be covered under an E&O policy.
Strategic renewal approach
Retail agents should start renewals early and engage experienced E&O specialists. With many markets competing on price, expertise and coverage precision matter more than ever. Manuscript forms tailored to an agency’s operations remain essential to avoid unintended gaps, particularly for larger firms.
The London Market has become increasingly active in Agents & Brokers E&O, particularly for excess placements and complex risks. Syndicates are demonstrating renewed appetite for professional liability, often stepping in to fill higher layers where U.S. carriers are conservative. London’s creative underwriting and ability to craft bespoke policy language continue to provide critical capacity, especially for large brokers or retail agencies with unique exposures.
Be on the lookout
- While the current market is characterized by broadening coverage terms and increased competition, carriers are approaching absolute exclusions (i.e., those related to employment practices, ERISA, bodily injury and property damage) differently. These exclusions, when applied without careful modification, can unintentionally narrow coverage for the very professional services that E&O insurance is intended to protect.
Insight provided by:
- Bill Dixon, EVP, Amwins Brokerage
- Sam Little, SVP, Amwins Brokerage
- Karen Lombardo, Managing Director, Business Risk Partners
- Steve Vallone, EVP, Amwins Brokerage
FI/Asset Managers
The asset management insurance sector is experiencing a controlled transition as we look towards 2026. Legal, technological and regulatory factors continue to influence carriers as they focus on expanding into underserved markets, prioritize product innovation and leverage data to optimize underwriting and risk assessment. Elevated loss activity in segments such as private equity is creating isolated pockets of capacity constraint, highlighting the importance of targeted program design.
Capacity and pricing
With strong carrier appetite and a flurry of new entrants—including established markets debuting new primary forms and startup MGAs—the asset management space is benefitting from best-in-class, loss-free accounts and seeing flat or even reduced rates, especially within primary and lower excess layers.
That said, competition is intense, and renewal retention is driving aggressive pricing behavior. Accounts with distressed profiles—defined by adverse loss history or higher-risk strategies (e.g., credit, lending, or crypto)—may face rate increases, tighter terms and higher retentions. Many markets have signaled less flexibility for private equity risks given overall loss trends. Lower limits and higher retentions are increasingly common, and building larger towers has become more challenging and expensive as excess layers increase rate factors.
We anticipate the competitive landscape will continue, particularly for clean accounts, while insurers will likely continue seeking higher retentions and narrower coverage grants for more complex or loss-affected risks, especially within primary placements.
Coverage limitations and underwriting
Despite increasing capacity, underwriting appetites are tightening in certain areas. Carriers are requiring insureds to retain more risk, especially for firms with heightened exposures or unfavorable claims experience. Excess layers remain broadly available, but policy language continues to evolve to address emerging risks such as digital assets, crypto and technology-driven exposures.
Heading into renewals, it’s important to:
- Prepare for potential higher retentions on primary placements, especially for private equity risks.
- Highlight compliance readiness for new regulations (e.g., SEC Private Fund Adviser Rules) to demonstrate how firms have addressed them.
- Focus on program structure improvements beyond price; coverage refinements remain an effective differentiator.
- Recognize that firms with significant crypto exposure still face limited market appetite, often resulting in elevated premiums and retentions.
Market dynamics
Regulatory & litigation trends
Increased regulatory scrutiny, expanded disclosure requirements and an active plaintiff bar are driving claims severity and loss costs. The phase-in of the SEC Private Fund Adviser Rules is expected to trigger additional inquiries and enforcement actions now through 2026, adding to already elevated defense cost trends driven by social inflation.
Industry consolidation & launch activity
The asset management industry is experiencing simultaneous consolidation and expansion. PwC projects 16% of asset and wealth management firms will be acquired or shuttered by the end of 2027, with M&A activity exceeding $5.7B in 2025. At the same time, thousands of new funds and managers launch annually, particularly in alternatives, ETFs and crypto. The U.S. leads in volume, Europe emphasizes private equity and APAC drives growth through retail demand and pension reform.
Technology & AI
Carriers are increasingly adopting AI-driven underwriting and claims tools. For insureds, this raises expectations for data transparency, governance and robust cyber controls. Firms with well-documented systems and model oversight are best positioned for favorable underwriting outcomes.
Emerging risks
As we head into 2026, systemic exposures may intensify. Cyber, ESG and reputational harm continue to be key drivers of loss frequency and severity. Coverage lag in fast-evolving spaces such as crypto, digital assets and AI, where policy language may not fully capture emerging risks, remains a critical area to monitor.
Strategic renewal approach
Success in the 2026 market will hinge on delivering well-documented, transparent and organized submissions. Engage early with incumbent carriers and new entrants, review limits, deductibles and policy language and seek opportunities to enhance program structure. Assessing the claims-paying reliability, financial strength and service track record of emerging carriers will also be key.
Be on the lookout
- Coverage may continue to narrow, particularly in excess placements, as underwriters reassess exposures related to crypto, private equity and ESG.
- Consolidation remains a defining theme, with heightened M&A activity anticipated as subscale firms face pressures from fees, technology requirements and regulatory expectations.
- AI adoption is reshaping underwriting and claims processes, enabling participants to leverage more advanced data capabilities.
- Globally, increased ETF and active fund launches are expected across APAC and Europe, while the U.S. maintains its leadership.
Insight provided by:
- Andrew Pritchard, EVP, Amwins Brokerage
- Jenny Fraser, VP, Amwins Brokerage
D&O
Following several years of aggressive competition and rate erosion, the D&O marketplace remains favorable for buyers but is beginning to show early signs of stabilization. Capacity remains abundant across all segments, drawing new entrants and keeping terms competitive.
While market conditions continue to favor insureds, brokers are turning their attention from price to protection, leveraging the current environment to secure broader terms and maximize value for clients. However, carriers appear increasingly cautious as regulatory scrutiny intensifies and financial pressures mount.
Capacity and pricing
The D&O marketplace is showing signs of stabilization as the prolonged period of rate reductions reaches its floor. While an abundance of capacity continues, particularly across private, nonprofit and smaller public company segments, flat renewals are becoming the norm as carriers attempt to hold firm on pricing.
Despite isolated exits and adjustments from other insurers, new MGAs, insurtechs and carriers continue to enter the space, keeping competition strong and premiums low. Brokers report limits being marketed aggressively, with $10M placements increasingly common, further compressing demand across D&O towers. Many believe the market is approaching an unsustainably low pricing level, suggesting potential for firming if claims activity or regulatory enforcement increases in 2026.
Coverage limitations and underwriting
Coverage remains broad, but underwriting practices are tightening in response to financial stress and increased insolvency risk. Carriers are introducing bankruptcy, insolvency and creditor exclusions for financially challenged insureds, which can be particularly problematic in today’s environment.
Underwriters also continue to show caution on regulatory and antitrust coverage, especially in healthcare, government contracting and dominant market positions. Some are introducing consumer protection or cyber exclusions and employing sublimits in sensitive classes.
On the positive side, competition is still enabling brokers to expand terms, especially for buyers represented by knowledgeable intermediaries who are pushing for coverage enhancements. Amwins’ proprietary solutions, including the Amwins Portco form, continue to stand out in this environment.
Market dynamics
Regulatory & litigation trends
Regulatory oversight continues to evolve, with the SEC and Department of Justice expanding scrutiny around AI-related disclosures, cybersecurity and ESG (or “greenwashing”) claims. Enforcement in these areas is expected to increase into 2026, influencing both underwriting appetite and retention levels.
Agencies, including the Equal Employment Opportunity Commission (EEOC), Department of Labor, National Labor Relations Board (NLRB) and FCC are also shifting enforcement priorities, creating uncertainty for corporate boards and insurers alike.
Third-party litigation funding and social inflation remain key drivers of rising defense and settlement costs, particularly in the public company D&O segment.
Technology & AI
Artificial intelligence is emerging as both a tool and a risk driver. Brokers are seeing increased concern around what many are referring to as “AI washing,” when companies overstate their AI capabilities which could lead to potential misrepresentation claims.
Retailers should ensure that D&O policies do not inadvertently exclude AI-related exposures under technology or cyber exclusions. Coordinating D&O and cyber programs is critical to prevent coverage gaps as these claims develop.
Emerging risks
Macroeconomic pressures, including persistent inflation, tariffs and tightening credit markets, are increasing financial stress across industries and leading to more bankruptcies and restructuring activity. These developments heighten the importance of proactive coverage management, particularly obtaining broad Side A protection early.
Strategic renewal approach
As the market begins to level out, retailers should focus on leveraging competition to enhance coverage, not just lower premiums. Flat or modestly reduced pricing creates opportunities to improve policy breadth, especially around Side A protection, insolvency language and regulatory coverage.
Amwins’ depth of market relationships and proprietary solutions—including its broad Side A DIC form backed by A+ MSIG paper—equip retailers to deliver strong value even as rate decreases slow. Early engagement and collaboration with experienced D&O specialists remain key to navigating distressed accounts and securing optimal protection before financial conditions deteriorate.
Be on the lookout
- The market is showing signs of pricing stabilization, as carriers resist further reductions and flat renewals become the norm.
- Some insureds are beginning to use AI tools to review their D&O policies, often generating inaccurate or misleading interpretations. Retailers should be aware of this trend and engage your broker if clients raise questions or concerns based on AI-generated policy analyses.
Insight provided by:
- Aileen Spiker Berry, EVP, Amwins Brokerage
- Corey Turner, SVP, Amwins Brokerage
- Dom Calcott, Director, Amwins Global Risks
- Jamie Taylor, VP, Amwins Brokerage
- Joe Robuck, EVP, Amwins Brokerage
- Philip Collins, EVP, Amwins Brokerage
- Scott Misson, EVP, Amwins Special Risk Underwriters
- Seth Brickman, Managing Director, Business Risk Partners
EPL
The EPL market remains active and complex, characterized by open capacity and heightened underwriting scrutiny. Navigating the intricacies of technological advancements throughout HR processes, steady claim frequency and social inflation make EPL a line to watch closely through 2026.
Capacity and pricing
Capacity remains generally available, supported by new entrants and competitive pressure. However, carriers are more selective in higher-risk states (CA, NY, IL) and industries such as technology, hospitality and healthcare. Persistent claim frequency, particularly in wage and hour (W&H), DEI, discrimination, harassment and wrongful termination cases, is keeping rates and SIRs relatively flat, despite an abundance of capacity. Some placements require strategically structuring primary and excess layers, offering sublimits on primary policies with dropdown sublimits on excess. Renewals often prompt marketing activity, keeping the marketplace fluid but cautious.
Coverage limitations and underwriting
W&H coverage continues to be heavily restricted, especially in California, with limited and costly options. Markets are tightening exclusions around WARN Act coverage, biometric privacy and pay transparency obligations. An increase in underwriting scrutiny adds an additional challenge, as the focus is primarily on prior EPL claims, HR practices, employee handbooks, training programs and compliance with state-specific employment laws. Employers with multi-state operations may face separate retentions or sublimit structuring to manage risk effectively.
Market dynamics
Regulatory & litigation trends
State and federal legislative changes are reshaping EPL exposures, with notable drivers including wage transparency, pay equity, biometric privacy, AI in hiring and the Pregnant Workers Fairness Act. California’s complex labor laws and high claim payouts continue to challenge carriers while across the country, social inflation and third-party litigation funding are increasing verdict sizes and settlement amounts, often resulting in nuclear verdicts. Mass layoffs, coupled with regulatory change, are also doing their part to contribute to higher risk scrutiny.
AI and emerging workforce risks
The increasing use of AI and automation in hiring, performance management and HR processes introduces new EPL exposures. Algorithmic bias and lack of transparency in automated systems can result in discrimination claims. As a result, some states, including Colorado and Illinois, have required AI bias audits, and the EEOC has flagged algorithmic bias as an enforcement priority.
These technology-driven risks are also having an impact on workforce structures. Hybrid and remote work models may create disparities between employees, raising privacy, equity and compliance concerns. Beyond that, mass layoffs and reliance on AI or automation increase potential claims in W&H, discrimination and wrongful termination. Together, these factors make proactive compliance, monitoring and strategic policy structuring essential to mitigating EPL exposures.
Strategic renewal approach
For upcoming renewals, carriers and brokers should focus on early engagement with clients, clear communication about exposure changes and proactive compliance measures. Key strategies include:
- Reviewing prior claims and HR practices before renewal discussions.
- Monitoring state-specific regulatory changes to anticipate coverage or premium adjustments.
- Considering separate state retentions and primary/excess sublimit structuring.
- Advising clients on proactive risk management, including updated handbooks, AI audits, training programs and documentation of layoffs or employment decisions.
- Providing details of remedial actions significantly increases the chances of receiving competitive terms for clients that have experienced prior claims.
These measures help mitigate surprises at renewal and maintain competitive placement in challenging markets.
Insight provided by:
- Christina Allen, VP, Amwins Bermuda
- Cindy Brandt, SVP, Amwins Brokerage
- Joe Robuck, EVP, Amwins Brokerage
- Kendall Bundy, VP, Amwins Brokerage
- Kirsty Mitchell, Divisional Director, Amwins Global Risks
- Matt Wischnowsky, VP, Amwins Brokerage
Lawyers Professional Liability (LPL)
The lawyers professional liability (LPL) market remains decisively soft, with an abundance of capacity. There are currently more than 60 markets actively writing coverage and new entrants continue to emerge. Carriers are competing aggressively to hit growth targets, often offering lower rates and enhanced limits.
Small firms remain highly competitive. Mid-size firms (25 to 100 attorneys) are seeing small to mid-single-digit rate decreases and expanded admitted options. Large firms (100+ attorneys) are seeing more stable pricing, with most markets looking for some level of inflationary rate increases unless claims experience dictates otherwise. Excess pricing remains favorable, with layers often priced at 35% to 40% of the underlying, and in some cases, deals as low as $2,000 per million.
Coverage limitations and underwriting
We are seeing aggressive underwriting across the market, with carriers offering expanded eligibility and coverage, including coverage for cannabis-related work and even for non-attorney paraprofessionals in certain states. However, most carriers either sublimit or exclude cyber entirely, with a particular focus on excluding coverage for loss of client funds through a breach or social engineering attack. The best practice is for insureds to purchase standalone cyber coverage.
Market dynamics
Regulatory & litigation trends
Social inflation and rising defense costs are pushing claim severity upward, particularly for large firms, with several settlements exceeding $100M in recent years. Litigation funding is also fueling claims that might not otherwise proceed. Meanwhile, regulatory activity creates additional work opportunity for attorneys as businesses navigate continued uncertainty, particularly around tariffs.
Technology & AI
Generative AI (GenAI) represents both opportunity and risk. From contract review to legal research, law firms are adopting AI tools at accelerating rates. However, improper use has led to real-world sanctions and reputational damage (e.g., legal briefs containing “hallucinated” cases).
Emerging risks
Exposures tied to cryptocurrency, Know Your Client/Anti-Money Laundering lapses and vendor contract indemnities are drawing increasing scrutiny. Some tech vendors have even inserted clauses allowing use of client data for AI model training, creating potential confidentiality and professional liability breaches.
London
Overall, competition remains strong across the segment and London continues to play an important role, particularly in large firm and high excess placements. Capacity is tightening modestly on higher layers following a series of large losses; however, there is increased insurer appetite combined with modest premium reductions following several hard-market years.
Be on the lookout
- Cyber exclusions are tightening, and standalone coverage remains essential. However, we are seeing expanded admitted appetites for previously hard-to-place classes (IP, ETP, bankruptcy).
- As ethics opinions evolve, firms must ensure human oversight and stay current with state bar guidance.
- Carriers are not yet routinely asking about AI use, but that will likely change.
- In this soft market, strategic discipline is key. Retailers should focus on preserving coverage continuity and avoiding short-term savings that could lead to long-term exposure gaps.
Insight provided by:
- David W. Collins, Esq., SVP, Amwins Program Underwriters, Inc.
- Bill Schmitt, SVP, Amwins Brokerage
- John Muller, SVP, Risksmith Insurance Services, LLC
![]()
AI
The Ongoing Impact of AI on How We Do Business
Artificial intelligence (AI) is changing the way we all work and is reshaping the insurance ecosystem more rapidly than any innovation in recent memory. From underwriting to claims to customer experience, AI is transforming how risks are evaluated, how brokers work and how insureds expect to be served. For brokers, this shift isn’t just technological, it’s strategic. The firms that embrace AI will operate with more accuracy, more speed and more insight, reshaping the value they deliver to clients.
Driving productivity
AI has the power to process vast amounts of information, recognize patterns and streamline decision-making. These advanced analytics can help organizations make data-driven decisions, anticipate market shifts and create products and services to meet individual customer needs. And as the technology continues to evolve, it will influence how businesses compete and create value.
Amwins understands this opportunity and is committed to investing in not only the technology itself, but the people who use it. We believe that AI enhances our team, making us more productive and efficient, without changing the core of how we do business or the relationships that drive our success.
Amwins’ investment in AI
Amwins has prioritized data and analytics since our founding. It’s part of who we are. Whether it’s Amlink, our enterprise management system used to manage accounts and maintain client information or Amwins IQ, our retailer facing quoting portal that targets small and middle market accounts, we have always invested in technology that strengthens the specialty placement process.
Our ongoing, significant investment into AI builds on this foundation and supports the continued development of these proprietary solutions. Our in-house data scientists are working in partnership with our business leaders to tackle complex, firm-wide opportunities that redefine how we approach wholesale broking and underwriting – operationalizing AI so we can work smarter, not harder, and deliver more value to our clients.
Amwins DNA
The industry’s most in-depth collection of E&S insurance information, Amwins DNA is foundational to how we support our colleagues, retail clients and market partners. It also serves as the backbone to our AI-driven solutions. The sheer volume of data available through Amwins DNA helps us:
- Understand the risk appetite of our market partners for better placement decisions.
- Provide client deliverables, such as coverage benchmarking, to equip our clients with knowledge and tools that their insureds will value.
- Efficiently identify expertise within our firm to help ensure that risks are matched with the right specialists and markets.
Where most companies must look externally to provide the necessary data to help build their infrastructure, Amwins already has it. This strong and stable data ecosystem enables our data scientists to do what they do best: – analyze data, build smarter tools and enhance the user experience for brokers, underwriters and retailers.
It also allows our team to provide unique solutions for your clients. Have a challenging account that needs specific coverage? AI enables us to quickly search millions of policy documents and submissions to find relevant examples and potential solutions for the insured.
Unlike 95% of enterprises that struggle to integrate AI tools in their workflows, Amwins is using AI to bring the collective knowledge of the firm to support a single client, – further differentiating us and you from the competition.
Proprietary AI tools
Amwins provides all our colleagues with access to the best AI tools, resources and processes to take the friction out of our workday. That means faster research, smoother workflows and more time to focus on what matters most.
- AmChat is a proprietary general-purpose AI tool that enables brokers and underwriters to make quote comparisons, extract loss run data and get started using AI quickly and easily. Unlike other enterprise-grade systems that see only about a 5% production rate, our system offers contextual learning and alignment with day-to-day operations.
- Property market selection tools give our brokers the distinct ability to quickly identify markets with aligned risk appetite.
- AI-enabled workflows mean better service for our clients and more capacity for our teams. These workflows operate 37 times faster than manual processes, increasing efficiency and productivity.
Enabling everyday tasks
According to the recent MIT NANDA report, The GENAI Divide, while more than 80% of organizations have explored or piloted tools like ChatGPT and Copilot, only 40% report deployment. Amwins is in that 40%.
Across the organization, Amwins is weaving AI into the routine tasks that shape our daily workflow. From summarizing complex submissions to quickly locating historical account activity to drafting clear, client-ready communications, AI helps our teams work with greater speed and precision.
These enhancements don’t replace expertise, — they amplify it. By removing administrative friction and giving colleagues instant access to insights that once took hours to find, AI allows our brokers and underwriters to stay focused on the strategic, relationship-driven work that defines our value.
Market dynamics
New technology exposes new risks. As a result, many carriers have moved to restrict or exclude AI-related losses. Verisk’s Core Lines Services has developed and submitted standard exclusion policy language across multiple states that will become effective January 1, 2026. It remains to be seen if insurers that have authorized Verisk to make filings on their behalf will adopt this exclusionary language. The same can be said for the insurers that have made similar filings with state insurance departments.
When the potential for broad exclusionary endorsements is combined with the fact that definitions for AI and GenAI can vary and are often inconsistent, companies taking advantage of AI in back-office efficiencies as well as product development will likely be faced with gaps in coverage. In response, a new specialty class of business designed to close these gaps has emerged.
The E&S/wholesale market, – with its greater flexibility to react quickly to new and changing markets, – is offering policies designed to tackle not only liability coverage, but the inherent exposure that comes through third parties as well as misuse and misappropriation of data. It is widely expected that these initial policies will evolve to provide coverage for algorithmic failures, bias in data and autonomous system failures.
London
While the market continues to struggle with just how to address the challenges AI presents overall, we are starting to see some carriers roll out tailored coverages.
Broadly, AI-adjacent risks among insureds providing services such as workflow automation remain difficult to place in London. Because of the significant exposure many professional services companies face, premiums and retentions are high.
More specifically, AI companies themselves are the area most markets shy away from as privacy and intellectual property (IP) exposures can be hard to quantify from an underwriting standpoint. The ongoing uncertainty around who owns the IP in AI-generated outputs also complicates matters.
Be on the lookout
- Demand for AI coverage is clearly growing and underwriters are devoting more resources toward understanding the exposure, taking a more forward-looking stance on coverages.
- Many existing programs still appear to lack the needed substance to provide insureds with the real innovation required by these emerging risks, but we are watching closely and expect to see further developments over the next 12 months.
Insight provided by:
- Michael DeGusta, Chief Technology Officer, Amwins
- Ashley Kaiser, SVP of Strategy, Amwins
- Oche Ojabo, Sr. Broker, Amwins Global Risks
![]()
Economic Overview
The U.S. economy is entering 2026 in a fog of mixed signals. Delayed government data due to the U.S. shutdown, elevated inflation and rising unemployment rates have added uncertainty to the outlook. The Federal Reserve has been lowering interest rates slowly. But with U.S. consumer inflation at 3%, it remains above the Fed’s 2% target (even if it is sharply lower than the 9.1% year-on-year rate in June 2022).
Interest rates are still high by historical standards, and the Fed’s gradual easing is creating uneven outcomes across major sectors. Unless interest rates begin to fall more significantly, the housing market is at growing risk of stagnation.
The labor market remains strong, with unemployment still consistent with near full-employment dynamics. But payroll gains have slowed drastically over the past two years. Elevated borrowing costs and slowing job growth seem likely to keep pressure on home prices and multifamily rents, especially as more supply enters the market.
Policy uncertainty is likely to remain the major theme in the year ahead. Following the uncertainties of 2025, trade, tariffs, immigration rules and geopolitical flashpoints in Cold War Two are poised to continue influencing business decisions. These risks complicate capital planning. However, they are also accelerating long-term structural changes like U.S. reindustrialization for a wartime-ready economy that could support U.S. economic growth, including reshoring, nearshoring and investments in supply chain resilience.
Geopolitical and economic security priorities are reshaping U.S. corporate strategies, with countless companies across sectors building redundancy, regionalizing production and expanding automation and AI use to drive productivity gains.
Overall, the outlook for 2026 is one of cautious optimism. Inflation is moving in the right direction, labor markets remain on a relatively positive footing and gradual Fed interest rate cuts could support some improvements in sentiment. Firms that maintain fiscal discipline, embrace AI and align with emerging industrial policy priorities will likely be best positioned to capture new opportunities in the year ahead.
Insight provided by:
- Jason Schenker, President of Prestige Economics and Chairman of The Futurist Institute
![]()
Reinsurance
The reinsurance market is navigating a period of adjustment following several years of volatility. While competition has intensified amid abundant capacity, the market appears to be finding its footing, with signs that recent rate decreases may begin to level off as renewal season approaches.
Capacity and pricing
Signs of stabilization following a period of notable softening continue with ample capacity available across both traditional and alternative capital sources. Reinsurers are deploying larger line sizes and showing greater flexibility, particularly in high excess layers with limited CAT exposure. This has reduced the need for multiple participants to complete placements, streamlining the process for cedants and brokers alike.
While rate decreases have persisted, they are trending toward moderation. Following the substantial 30% to 40% reductions seen earlier in the cycle, we anticipate that any continued downward movement will likely slow to 10% to 15%, assuming no major global catastrophe events occur. The competitive environment has also encouraged admitted carriers to revisit previously restricted classes, offering larger sublimits and reengaging with risks they had stepped away from, such as food processing and manufacturing exposures.
While reinsurers continue to compete on both price and terms, the pace of softening is expected to ease as treaty renewals approach and market discipline reasserts itself.
Coverage limitations and underwriting
Underwriting standards have loosened modestly, though reinsurers remain cautious in high hazard zones prone to convective storms, wildfires and flooding. Many are employing refined underwriting models and selective deductibles to manage exposure, most notably wildfire and water damage deductibles. The market is also seeing more nuanced valuation approaches, including shifts between replacement cost and actual cash value for roofs and other property elements.
Beyond property, reinsurers maintain a disciplined stance on terms and conditions, with underwriting difficulty still high for risks exposed to secondary perils, now considered primary by many due to loss frequency. Continued emphasis on engineered risk documentation and detailed data remains essential for securing competitive placements.
Market dynamics
An influx of capacity and new market entrants, including MGAs and fronting carriers with lower cost-of-capital models, has intensified competition. This has enabled insureds and brokers to drive placements, reversing the leverage reinsurers held during the hard market period.
In certain regions, capacity withdrawals from admitted markets, particularly in states heavily affected by convective and wildfire losses, have created opportunities for E&S carriers and reinsurance-backed structures to fill the gap. As a result, facultative and treaty reinsurance have become increasingly important tools to support growth and stability in these transitioning segments.
Regulatory & litigation trends
Globally, regulatory changes have had limited direct impact on reinsurance terms to date, though reinsurers are closely watching evolving solvency and capital adequacy requirements that may affect underwriting appetite. In the U.S., litigation funding and social inflation continue to pressure underlying carriers; however, these trends have not yet materially altered reinsurance structures.
Economic conditions remain a key factor. Inflationary pressures and rising tariffs are indirectly influencing claim costs, as material and labor expenses increase the ultimate severity of losses. Should investment returns weaken, reinsurers may reevaluate their portfolios, potentially tightening capacity or reassessing pricing models.
Emerging risks
Global reinsurers remain attuned to evolving exposures across cyber, terrorism and climate-related perils. Cyber and terrorism protections are seeing broader adoption in both mature and developing markets, reflecting heightened awareness of systemic risks and geopolitical volatility.
Additionally, flood risk remains a major concern as climate change alters loss patterns. Increased frequency and severity of convective storms and wildfires that were once considered secondary perils are reshaping portfolio strategies and pricing models. As these risks evolve, reinsurers are deploying sophisticated modeling and diversifying structures to maintain resilience.
Strategic renewal approach
With competition at its peak, the renewal landscape demands a thoughtful and strategic approach. Creativity in structuring, such as layering adjustments, refreshed primaries or introducing new participants to placements can yield significant benefits. Understanding which markets are deploying net versus treaty capacity can also uncover opportunities for improved pricing and efficiency.
The key to success in this environment lies in collaboration. Partnering with Amwins Re and leveraging our wholesale brokerage network enables clients to present a unified front to the market, maximizing leverage, insight and execution power. Engineered, well-documented risks will continue to see the best results, as reinsurers prioritize clarity and completeness in underwriting data.
London
The first half of 2025 presented significant challenges for the London Market. As rates declined more sharply than expected, major reinsurers that are often slower to respond to market fluctuations faced pressure to maintain renewal levels amid intense competition. Many London participants, still focused on higher-margin direct business, were hesitant to deploy reinsurance capacity, tightening available options for cedants early in the year.
Securing new opportunities has proved difficult, as incumbent direct insurers, both in London and the U.S., aggressively cut rates to retain renewals. Unless terms are particularly competitive, new entrants have struggled to establish meaningful shares. In many cases, cedants have opted to retain smaller participations rather than cede them, limiting facultative deal flow.
As the year has progressed, a more pragmatic tone has emerged. Direct insurers are increasingly recognizing the importance of reinsurance flexibility to support both renewal retention and growth. Shorter primary layers and buffer excess layers have become less common, with direct placements stretching to higher limits. This has created opportunities for reinsurers to participate in broader, more attractive layers or for cedants to adopt a “write and buy” approach, using facultative protection to manage net retentions.
As hurricane activity remained subdued through the end of 2025, London’s facultative market may see a stronger close to the year and a more balanced renewal season in 2026, driven by a renewed appetite for both writing and purchasing facultative protection.
Insight provided by:
- Jennifer Keefe, VP Marketing, Amwins Re
- Nigel Fearon, Director, Amwins Global Risks
- Tom Jakob, Director, Amwins Global Risks
![]()
Construction
Builder’s Risk
The builder’s risk insurance market is feeling the effects of evolving risk profiles and significant capacity expansion. Rate softening is widespread and expected to continue, driven by heightened competition and hesitation among developers facing tighter margins and macroeconomic headwinds.
Rates and project activity have been at an all-time high over the past several years, with some carriers seeking to deploy capital through MGAs in a bid to join an attractive market landscape. As a result, carriers are now relying on the specialized underwriting expertise of MGAs and their operational agility to strengthen market presence.
You can read more about the state of the builder’s risk insurance market here.
Market dynamics
Regional trends
Florida has shown meaningful improvement in capacity and deal structure, while markets like Louisiana remain difficult due to legal and litigation-related concerns. The Southeast and Gulf Coast are beginning to see pricing recalibration. In the West, demand remains steady, but high replacement cost valuation and CAT exposure continue to pressure both carriers and insureds. In the Northeast and Midwest, competitive conditions have returned more quickly, though carriers are still prioritizing risk quality and deal structure over volume.
Technology & AI
Loss prevention technology continues to be a key factor in risk assessment. Developers incorporating water flow detection systems, AI-powered security platforms and damage mitigation tools are increasingly viewed as higher-quality risks.
Builder’s risk underwriters are also beginning to consider the implications of digital construction management platforms, smart sensor integration and even early-stage adoption of digital twin technology. These tools offer real-time monitoring, predictive analytics and enhanced transparency—creating opportunities for more proactive risk engineering and claims response.
Emerging risks
Another emerging trend is the growth of modular and prefabricated construction. These approaches can offer cost and time efficiencies but may introduce new risk considerations during transport, assembly or structural integration.
Casualty
The construction casualty market remains firm but fragmented. Primary coverage continues to benefit from consistent capacity and manageable pricing pressure, seeing flat to single-digit rate increases. Excess underwriters, on the other hand, are broadly seeking rate increases between 7% and 15% (with spikes above 20% for distressed risks). Clean accounts can still secure favorable terms, but even these are being priced more conservatively.
Capacity remains available but is being deployed selectively. Carriers are pulling back on limits, tightening per-project aggregates and maintaining a firm stance on exclusions. There is room, however, for negotiation when creative program structures, alternative markets and clear risk mitigation strategies are brought to the table.
Creative program structures are becoming essential with solutions such as quota shares, bifurcated towers and captive layers to help manage costs and ensure adequate coverage. These approaches can improve placement options, increase participation from facultative markets and make it easier to replace capacity when needed.
You can read more about the state of the casualty construction insurance market here.
Market dynamics
Regional and class-specific trends
Commercial construction is seeing ample capacity and competitive pricing, especially for clean, well-managed accounts. Project-specific general liability (GL) programs, including GL-only wrap-ups, are also maintaining traction, particularly in the E&S market.
Conversely, for-sale residential construction in construction defect states (including Florida, California, Colorado, etc.) and auto-heavy civil construction projects continue to see limited appetite and steep pricing. Fleet exposure, especially in markets like Texas, Georgia and California, is a major concern.
Despite anticipated casualty market improvements resulting from tort reform, Florida markets in the for-sale space are either leaving the state completely or pushing rate to levels not seen since 2005/2006 and driving capacity down. Claims during the actual course of construction have also been higher than expected and completed operations claims are still being aggressively litigated by the plaintiff bar.
In New York, there’s stiff competition among retailers looking for creative solutions in what has become an evolving market. Insureds are looking for lower premiums and some direct markets are offering lower pricing on the supported lead umbrella in response. At the same time, some E&S carriers are still looking for rate on clean accounts; however, they are the exception not the norm.
Regulatory & litigation trends
Litigation hotspots are shifting with smaller venues like Cook County, IL drawing concern due to escalating verdicts and litigation trends. Even accounts with clean histories face increased scrutiny based on jurisdiction alone.
Professional lines
The professional lines market remains stable and competitive, with increasing capacity from more traditional E&O carriers and MGAs, as well as more traditional environmental markets that are expanding coverage into the contractors E&O space. Premiums on accounts with typical risks and no claims issues are flat to down slightly. More challenging risks (e.g., geotech, roads/bridges and residential) may see higher rates.
Underwriters in the space are managing capacity on tougher projects and challenging jurisdictions, including New York, Florida and Texas. Difficult classes include condos, New York risks, geotechnical and roads/bridges. Brokers are having to become somewhat creative to get terms in these classes/venues, offering alternative structures to traditional risks (i.e., quota sharing).
Other notable changes include an increasing demand for coverage enhancements and ongoing requests for faulty workmanship and rectification coverages. While we are seeing more carriers offer these grants, it’s important to note that all policy language is not created equal and should be thoroughly vetted rather than taking a simplified checklist approach so as not to mislead and expose the agency to potential E&O claims.
The same can be said when it comes to defining professional services. The definition should be scrutinized and compared to the contract as this coverage is often purchased according to contractual requirements. Many times, the definitions do not line up with the duties and obligations that are strictly required under the contract, resulting in coverage gaps for the general contractor and subcontractors alike.
Social inflation continues to play a key role in the market, as do the economic impacts on the cost of goods. However, if interest rates continue to ease, we expect there will be an uptick in project starts heading into 2026 and beyond.
From our underwriters
Underwriting discipline remains strong. Carriers are becoming increasingly selective, gravitating toward high-quality risks and exercising caution in more challenging geographies and project types. There is an overall reticence on the part of the carrier for total limits, including excess – especially where auto coverage is involved.
There may be instances where underwriters are willing to fight for better term conditions; however, technical underwriting standards are not being relaxed despite the flood of new capacity entrants in the builders’ risk marketplace. And we continue to see some carriers reduce limits in excess.
Builder’s risk coverage is also evolving. Some insurers are offering broader language, especially around exclusions like construction defects, but those provisions often fall short on actual protection. At the same time, thinner project margins and higher interest rates have increased the stakes. As construction timelines stretch, questions around claims handling (particularly during mid-project transitions) are gaining importance.
London
The U.S. construction insurance market has experienced a notable expansion in capacity, largely due to the activity of domestic insurers and MGAs. This development presents challenges for the London Market, which has observed a similar increase in capacity over the past 12 months. When combined with declining premiums and deductibles, as well as relatively low loss activity during the previous year, U.S. carriers have had to reduce their dependence on international markets.
One emerging trend we are seeing is the pressure many carriers are facing to limit exclusions, particularly when it comes to defects coverage on renovation projects involving existing properties. Where it was once standard to quote only the renovated property, expanding protection to the existing structure is becoming increasingly popular.
Given these current market conditions, clients may wish to consider securing period extensions at the time of binding. This strategy could enable them to lock in favorable rates and mitigate the risk of higher costs should market conditions tighten in the future.
Be on the lookout
- Private equity activity continues to shape the casualty market. Roll-up acquisitions have become common, especially in HVAC and plumbing, resulting in large, complex accounts with rapidly growing exposures and limited historical loss data. These insurance programs often require flexible structures and a strong integration strategy to maintain underwriting stability.
- In response to the premium-to-limit imbalance many large accounts face, the market is seeing increased use of structured and fronted programs.
- One notable innovation in the casualty marketplace is the rollout of Amwins’ excess casualty sidecar program. This exclusive product, available only through Amwins brokers, offers follow-form excess liability on a quota-share basis.
Insight provided by:
- Jett Abramson, EVP, Amwins Brokerage
- Matt Andrews, Sr. Managing Director, Amwins Program Underwriters
- Rob Best, Associate Director, Amwins Program Underwriters
- Shannon Campbell, EVP, Amwins Brokerage
- Grant Chiles, EVP, Amwins Brokerage
- TJ Collins, EVP, Amwins Brokerage
- Nick DelVino, EVP, Amwins Brokerage
- David Dow, EVP, Amwins Brokerage
- Brett Fowler, VP, Amwins Program Underwriters
- Liz Goldie, SVP, Amwins Brokerage
- Brooke Jenkins, SVP, Amwins Special Risk Underwriters
- Scott Jensen, EVP, Amwins Brokerage
- Gary Keenan, Managing Director, Amwins Global Risks
- Rachel Lindsey, AVP, Amwins Brokerage
- Kerry Pecora, VP, Amwins Special Risk Underwriters
- Gary Ricker, EVP, Amwins Brokerage
- Ryan Scheinfeld, CEO, Risksmith Insurance Services
![]()
Energy
After two years of turmoil, the energy insurance market enters 2026 with a mix of renewed competition and selective underwriting discipline. Rates are broadly softening across downstream property and professional lines, while casualty markets continue to wrestle with social inflation, nuclear verdicts and rising loss severity. Early 2025 began with notable losses, which temporarily slowed the pace of softening but did not reverse it.
While property markets benefit from abundant capacity and strong competition, casualty lines remain more constrained, with underwriters maintaining discipline on limits and retentions. As the energy sector adapts to rapid technological and operational changes, insureds can expect continued divergence between these two market segments in 2026.
Market dynamics
Downstream energy property sector
On the property side, the downstream energy market continues to soften. After several years of correction, 2025 brought consistent softening as capacity expanded and profitability improved. Despite rate reductions of up to 20% in some cases, the energy property insurance market outlook is relatively optimistic.
Non-CAT losses have already exceeded the total global premium for the downstream sector. Combined with the impact of several large natural catastrophe events, this has prompted close attention to the upcoming 2025/2026 reinsurance treaty renewals and early 2026 placements, which may signal whether the market adopts a more disciplined approach to ratings.
Capacity remains plentiful, with underwriters deploying larger line sizes on well-engineered, loss-free risks. Oversubscription has become commonplace, and maintaining market share is challenging. Soft-market incentives such as long-term agreements and no-claims bonuses have returned; loosening of retention levels and margins on key clauses like Business Interruption Volatility are being considered.
Underwriters are also paying closer attention to contractor performance and oversight, as well as supply chain issues, a key factor in recent loss events. Insureds should anticipate greater scrutiny around safety procedures, vendor qualifications and risk management frameworks at renewal. Despite this, competition remains strong for larger projects.
Power & renewables
The property-driven power segment continues to face evolving risks tied to rising energy demand and technological change. Population growth, elevated temperatures and energy consumption from artificial intelligence, electric vehicles and cryptocurrency mining are straining power infrastructure and contributing to higher attritional losses.
Battery storage and solar installations continue to expand, supported by insurer appetite for proven technologies with robust loss control. However, new or untested technologies still encounter tighter terms and limited capacity. The growing frequency of insured SCS events continues to be a challenge for insurers. While capacity has increased for the risk, the losses result in the insurer’s continued differentiation of individual projects and operators, especially in the solar industry.
Insurers are incorporating more sophisticated data analytics and AI-driven modeling to assess and price these exposures. As a result, insureds should expect more detailed information requests at submission and renewal to secure optimal terms.
Midstream sector
On the property side, the midstream market is showing rate relief, supported by competition from new entrants and expanded domestic capacity. However, conditions remain segmented. High-quality, well-managed assets are attracting rate decreases, while loss-affected risks face stricter underwriting review.
The casualty energy market, while stable, is beginning to flatten in terms of rate movement. Loss trends and auto exposures continue to keep pricing modestly positive, but new capacity is steadily entering the U.S. domestic market. As loss development from 2020–2024 continues to mount, underwriters are expected to hold rates near flat heading into 2026 rather than reversing the current direction.
The casualty market also continues to grapple with rising severity and litigation costs. Nuclear verdicts, third-party litigation funding and social inflation are driving claims inflation and limiting the extent of rate softening. Carriers are tightening their appetites, cutting limits and applying higher attachment points to manage volatility.
Jurisdictional challenges remain most acute in states such as Texas and Louisiana, where plaintiff-friendly venues have created pricing pressure and reduced available capacity. Although M&A activity has slowed under regulatory scrutiny, midstream remains active with new projects and asset expansions helping maintain overall demand for coverage.
Upstream energy sector
On the casualty side, reduced participation from long-standing carriers has created additional challenges, particularly for large accounts requiring significant limits. Fewer active markets have driven continued reliance on multi-carrier placements. Legal and jurisdictional severity in Texas and Louisiana remains a major factor shaping pricing and limit deployment.
Despite these pressures, the upstream segment remains stable overall. Pricing discipline is expected to persist into 2026, with reinsurance support and strong demand balancing out capacity constraints.
Professional lines
In professional and financial lines, favorable conditions continue. D&O insurance remains stable, with ample capacity and rate decreases for well-capitalized companies. Underwriters remain cautious with debt-leveraged or financially strained accounts, maintaining selectivity but showing a willingness to compete for quality business.
The cyber market is still one of the softest in the sector. Premiums are generally flat or modestly down year over year, supported by increased insurer confidence in underwriting controls and improved claims experience. While ransomware and class action privacy litigation remain ongoing risks, market sentiment is stable. For now, capacity and competition continue to outweigh claim volatility.
London
The London energy market remains an anchor for complex and international placements, defined by strong capacity, competitive pricing and fluid personnel movement among underwriters and brokers.
On the property side, rates are consistently down double digits, with an abundance of capacity, especially for well-engineered risks. The MGA space continues to expand in contrast to the U.S., where capacity has contracted.
Within casualty, social inflation and third-party litigation funding continue to pressure loss ratios, although London markets remain willing to support higher limits for well-performing accounts. While there have been no new widespread exclusions, PFAS and cyber exposures remain key focus areas for underwriters.
Overall, London markets are competitive, with abundant capacity. The trend is expected to continue through 2025, with an eye on 2026.
Be on the lookout
- As energy demand continues to accelerate, a strong focus on new AI-driven loss control systems, growth in thermal and renewables power developments, along with evolving technologies across the energy sector will continue to shape underwriting behavior across all segments.
- The overall market’s stability will depend on the balance between underwriting discipline and capacity deployment in the face of emerging risks.
Insight provided by:
- Ben Abernathy, VP, Amwins Brokerage
- Rob Battenfield, EVP, Amwins Brokerage
- Craig Dunn, EVP, Amwins Brokerage
- Johnny Hilliard, Divisional Director, Amwins Global Risks
- Edward McCafferty, Divisional Director, Amwins Global Risks
![]()
Environmental
The environmental market remains active and competitive, with noticeable softening in primary layers depending on class. Contractor Pollution Liability (CPL) and integrated casualty programs are seeing increased competition, as carriers broaden their appetites into non-traditional classes (street cleaning operations, forestry management, etc.). Several markets also remain active in the oil and gas sector, offering combined GL/Pollution/Professional programs and supported excess solutions for industrial and pipeline contracting services.
At the same time, the market continues to evolve under the weight of heightened regulatory and litigation risks, particularly surrounding PFAS and ethylene oxide (EO), prompting carriers to adopt more proactive underwriting and claims management strategies. While low-loss clients continue to benefit from favorable terms, including layered structures and long-term policy options, risk management has taken on greater importance as the industry contends with aging infrastructure and climate-related exposures.
Additionally, environmental coverage continues to play a growing role in mergers and acquisitions, real estate transactions and large-scale construction projects, where thorough environmental due diligence can help unlock better pricing and coverage flexibility.
Capacity and pricing
One of the biggest challenges in the environmental insurance market is the reduction in excess capacity, primarily due to large auto claims. This issue is particularly prevalent in Texas, where nuclear auto verdicts have led carriers to scale back their exposure. Historically, insurers willing to provide full $10M in excess limits have reduced those limits to $5M over the past few years. More recently, some carriers have opted not to renew accounts altogether to avoid being on the hook for substantial auto claims.
The contraction of excess capacity in transportation has led to pricing challenges. In many cases, insureds must secure standalone excess auto liability policies or multiple layered policies to reach the same coverage levels they previously obtained from a single carrier, increasing costs. While there have not been significant new market entrants, some notable carriers have pulled back.
A handful of carriers that typically focus on site pollution coverage have expanded into the tank space, possibly due to tightening conditions in the site market. However, these moves have been relatively limited rather than signaling a major market shift.
Coverage limitations
While no new exclusions have emerged in recent months, existing limitations remain significant. The PFAS exclusion remains prevalent across much of the market, though it is not universally mandatory. Coverage availability depends heavily on the insured’s exposure and risk profile, with some Pollution Legal/Site Pollution markets willing to underwrite limited or no-exposure accounts, and certain combined form markets offering affirmative coverage for contractors or consultants involved in PFAS testing and cleanup. A few markets focused on manufacturing and distribution will also underwrite the exposure, as well as several Contractors E&O/CPL markets.
The recent withdrawal of an EPA rule that had set strict PFAS discharge limits has created temporary relief for some industries, including chemical manufacturers and carpet producers, but insurers remain cautious. Additionally, wildfire exclusions are becoming more common for contractors operating in California and other high-risk states, reflecting the growing unpredictability of wildfire exposure.
Securing coverage is becoming increasingly difficult for insureds with older locations, aging infrastructure and outdated systems. Carriers are tightening policy terms and conditions, leading to higher deductibles, stricter underwriting and more limited coverage.
The surplus lines market is playing a critical role in filling coverage gaps where standard markets have pulled back, particularly for older risks that face financial responsibility requirements. For businesses that require coverage to meet financial responsibility mandates, policies must still comply with strict regulatory requirements, limiting the extent to which insurers can impose coverage modifications.
Market Dynamics
Emerging risks
The environmental insurance market continues to evolve as new contaminants and regulatory concerns gain attention. Several emerging risks should be on the radar for insureds and insurers alike, including risks related to microplastics, formaldehyde and phthalates. You can read more about these risks here.
Technology
The importance of telematics and GPS monitoring software has never been higher for insureds with trucking fleets. There has been a noticeable change in both lower claims frequency and severity with insureds who take advantage of this technology; however, insureds should make sure they’re using the software to actually manage their drivers, which could lead to lower insurance premiums.
Inflation and economic factors
Economic inflation continues to influence the market, particularly for environmental and energy contractors whose revenues are tied to oil prices. Because oil is a traded commodity, price fluctuations can cause significant swings in insured exposures. When revenues decline, securing coverage at favorable rates can be challenging due to minimum premium requirements.
While social inflation has had a significant impact on manufacturing risks—particularly in relation to PFAS and other high-profile environmental concerns—it has been less pronounced for contractor-based accounts.
At the same time, businesses facing inflationary pressures are adjusting their coverage strategies. Some insureds, particularly in dealer auto servicing and similar industries where pollution liability is discretionary, are choosing to go without coverage or increase their deductibles to help control costs. This trend highlights the balancing act businesses face between financial constraints and risk management.
Be on the lookout
- The cheapest coverage doesn’t always equate to adequate coverage. Be sure to look for potential coverage gaps.
- Continue to get to market early with complete submission information on larger-sized environmental accounts, especially those that include excess auto. For those insureds, they will need to complete an Auto Fleet supplemental form well in advance of the renewal date. This can also include MVRs, Fleet Safety Manua and Safety Data Sheets if transporting hazardous material.
Insight provided by:
- Matt Andrews, Sr. Managing Director, APU
- Andrew Couldridge, Sr. Underwriter, APU
- Susan Diecidue, AVP, APU
- Daniel Drennen, VP, Amwins Brokerage
- Quentin Fox, Underwriter, ANTU
- Matt Merlie, Sr. Underwriter, APU
- Bryan Mierzwinski, Associate Director, APU
- Brett Pollard, VP, Alta Risk
![]()
Healthcare
The healthcare market continues to work through a shifting market, with capacity, pricing and coverage terms evolving across multiple sectors. While new entrants and surplus lines carriers provide additional options in certain areas, claims severity, social inflation and regulatory pressures are creating challenges for both insurers and insureds.
Capacity, pricing & coverage limitations
Overall, the healthcare market is seeing a mix of easing and selective hardening. Competitive lines such as home healthcare and certain allied health segments maintain broad capacity and modest rate movement, while high-severity classes like human services are experiencing constrained capacity and substantial rate increases. New entrants, particularly in surplus lines, are helping to provide additional options, but carriers remain cautious in high-risk jurisdictions and accounts serving vulnerable populations.
Allied health
The allied healthcare space has softened over the past year, with rates generally flat to single digits on standard business, largely driven by new carriers entering the market and competing aggressively for new business. More challenging exposures continue to include correctional healthcare, hospital staffing and inpatient facilities such as drug and alcohol treatment centers. Carriers are increasingly limiting capacity, reducing excess limits from historical $5M to $10M layers down to $2M to $3M or, in some cases, non-renewing excess layers altogether.
High-severity jurisdictions like New York City, Philadelphia, Washington D.C., California, New Mexico and Florida remain under scrutiny due to heightened litigation risk and rising claim severity, particularly for professional liability. Coverage limitations continue to be a key focus, with sexual abuse coverage closely underwritten, especially for accounts serving vulnerable populations, and increased attention on hired and non-owned auto exposures.
Home healthcare
Home healthcare and hospice continue to benefit from a highly competitive marketplace, with more than 60 admitted and surplus lines carriers offering primary professional liability, commercial general liability and abuse and molestation coverage.
Coverage forms tend to be broader than many competitors, particularly regarding abuse and molestation limits, though pricing remains the primary challenge. Claims severity has increased, but the depth of market competition helps keep rate movement modest.
Life sciences
Life sciences exposures continue to draw close attention from carriers, particularly as emerging technologies and innovative business models expand the risk landscape. Sectors involving AI-driven diagnostics, direct-to-consumer health technologies and data privacy present unique underwriting challenges, requiring careful review of clinical trials, product development and regulatory compliance.
Capacity remains generally available, though insurers are increasingly scrutinizing operational protocols, quality control measures and risk management frameworks.
Coverage limitations are becoming more nuanced, with cyber liability, data privacy and technology-related exposures often requiring specialized endorsements or separate policy structures.
Pricing has remained competitive in lower-risk sectors but is hardening in areas with emerging liability or regulatory uncertainty. Additionally, carriers are closely monitoring potential exposure from diagnostics errors, medical device failures and AI-driven decision-making, which can result in higher claim severity. The continued expansion of direct-to-consumer health products and telehealth services also introduces new operational and reputational risks that require tailored policy language to ensure adequate coverage.
Human and social services
The human and social services sector remains one of the most challenging areas in healthcare liability insurance, serving vulnerable populations including children, seniors, disabled individuals and people in residential or foster care programs. The main factors driving the hard market stem from claims being brought forth from many years ago, triggering severely underpriced occurrence form policies. Additionally, SAM losses, particularly in the youth services sector, are fueling market volatility, with pricing increases ranging anywhere from 100% to 800% or more when moving from admitted to E&S carriers.
Capacity is constrained, with traditional package carriers reducing umbrella limits or withdrawing, while excess liability often requires layered structures and a lower limit deployment strategy.
Coverage exclusions are increasingly common, including background check enforcement, limitations on self-inflicted injury, elopement and SAM sublimits, making careful policy structuring essential. Tort reform involving the statute of limitations on sexual abuse and sympathetic juries, combined with vulnerable populations and third-party litigation funding, further contributes to high claim severity. Expansive service offerings, including youth residential risks, correctional healthcare and telehealth exposures, add additional complexity for this sector.
Specialized E&S carriers and experienced brokers, like those at Amwins, provide access through creative placement strategies and layered programs, while strong submissions detailing operations, staffing and risk management remain critical to securing favorable terms.
Senior care
In the long-term care and senior living segment, loss costs continue to rise due to social inflation, litigation funding and ongoing operational pressures. New entrants may offer aggressive pricing to capture market share, but carriers with longer histories aim to hold the line as claims experience deteriorates. Capacity for excess coverage is limited, with some carriers reducing available limits and excluding SAM on excess layers.
Coverage forms have evolved to include lower deductibles and first-dollar coverage, addressing the challenges of collecting on tougher credit risks. However, insureds face continued pressures from declining Medicare/Medicaid reimbursements and staffing shortages, which contribute to heightened underwriting scrutiny.
From our underwriters
Underwriters emphasize the importance of closely evaluating accounts. In the allied healthcare space, careful review of inpatient and correctional staffing exposures is critical, as these remain higher-risk areas for claims. Human services and senior care segments require detailed analysis of abuse and molestation risks, with a focus on both historical loss trends and ongoing operational controls.
Across all healthcare sectors, rising social inflation, nuclear verdicts and increased claim severity have driven underwriters to scrutinize risk management protocols, staffing practices and loss mitigation efforts more closely than ever. Coverage forms, deductibles and policy limits are being assessed in the context of real-world operational exposures, and underwriters are increasingly selective about excess capacity and attachment points.
New entrants in the market may offer aggressive pricing, but underwriters caution that these reductions are often not sustainable given the continued upward pressure from claims costs and litigation. On the other hand, carriers with long-term experience in healthcare lines bring both underwriting expertise and claims-handling capabilities, providing more stable pricing and terms over time.
Amwins underwriters also note the importance of comprehensive submissions and documentation. Detailed loss runs, staff counts, operational narratives and descriptions of corrective actions can help ensure that high-risk exposures are fully understood and appropriately priced. Programs like Amwins’ Long-Term Care Facilities highlight the value of structured solutions, including layered excess options, stand-alone excess and specialized placements to manage challenging exposures.
Market dynamics
Regulatory & litigation trends
Healthcare insurance continues to face complex regulatory and litigation pressures, particularly in jurisdictions such as California, New York, Pennsylvania and Florida. Reviver statutes and the expansion of lookback periods for abuse claims have increased potential liabilities for older incidents. Third-party litigation funding is also influencing claim severity and settlement values, driving higher pricing and more restrictive terms. Tort reform efforts, such as recent legislation in Georgia, may provide some relief, though results are still too early to assess.
Technology & AI
Telehealth, remote counseling and other technology-driven services are expanding exposure profiles for healthcare insurers. These innovations bring unique risks, including supervision gaps, cyber vulnerabilities and coverage questions regarding standards of care. Life sciences exposures tied to AI diagnostics, data privacy and direct-to-consumer health technology also require tailored underwriting and careful risk evaluation.
AI is increasingly used in many healthcare sectors, from diagnostics to drug development and clinical trial analysis. While these tools can improve efficiency, there is a growing risk that AI could misinterpret or generate inaccurate data during clinical trials, potentially leading to flawed results or regulatory complications. Insurers are paying close attention to how companies validate and monitor AI systems, ensuring proper oversight and compliance to mitigate liability exposures.
London
London markets continue to face similar pressures as domestic markets, with rising claims and social inflation driving pricing, attachment points and coverage terms. SAM claims have reached new highs, prompting London carriers to actively manage these limits and explore standalone solutions. London remains supportive of allied healthcare, long-term care and hospital programs, especially for large or hard-to-place risks, though correctional healthcare and social services exposures remain challenging. Full submissions with detailed claims histories and risk management protocols are essential to securing favorable terms in London.
Be on the Lookout
- Continued reduction in capacity for excess and SAM coverage is expected across human services and senior care.
- Heightened scrutiny in jurisdictions with strong litigation trends or expanded statutes of limitation is driving rate.
- Emerging technology and telehealth exposures require careful review for coverage and cyber risk considerations.
Insight provided by:
- Joe Carlson, SVP, Amwins Brokerage
- Jordan Connelly, EVP, Amwins Brokerage
- Amanda Fioretti, VP, APU
- Marie Gaudette, VP, APU
- Ryan Gillispie, EVP, Amwins Brokerage
- Joe Hare, SVP, Amwins Brokerage
- Gerald Helfrich, EVP, Amwins Brokerage
- Dylan Jordan, SVP, Amwins Brokerage
- Megan Kramer, VP, Amwins Brokerage
- Sarah Lambert, Divisional Director, Amwins Global Risks
- Don Tejeski, EVP, Amwins Brokerage
![]()
Hospitality
Overall, soft property market conditions continue, with increased capacity, broader terms and moderate rate decreases in most areas. The most notable reductions have been on layered risks, where carriers are taking on larger capacity shares, reducing the total number of participants needed on a placement. These favorable dynamics are attracting carriers back into classes they had previously exited, such as hospitality. And as the 2025 storm season was manageable, capacity should remain healthy, sustaining favorable terms for insureds through year-end.
While property capacity has expanded, casualty markets remain more cautious. Frequency and severity trends, driven by social inflation and nuclear verdicts, are creating pressure on GL and excess placements. Many excess liability carriers are limiting line sizes to $10M or less and are reserving higher limits for attachment points above $25M. Umbrella RPGs (Risk Purchasing Groups) that historically offered large limits at competitive premiums are tightening terms and pushing large increases (30% to 50%+), increasing the need for E&S capacity on umbrella/excess towers.
Capacity, pricing and coverage limitations
Underwriting remains mixed across lines. Property carriers have loosened guidelines to stay competitive, with some removing exclusions such as EIFS when strong risk management is demonstrated. Casualty carriers, however, are still contending with profitability challenges. Common exclusions, including human trafficking, A&B, firearms and SAM are now standard across most markets. In higher-liquor-receipt operations, admitted carriers are increasingly exiting, or raising minimum premiums and deductibles. Liquor liability exclusions in umbrella offerings are expanding, particularly in higher-hazard states.
Insureds investing in risk management continue to see the best underwriting outcomes. Carriers are rewarding proactive steps such as extending video retention, deploying software to track patron liquor consumption and partnering with consultants to strengthen defensibility in claims situations.
Market dynamics
Regulatory & litigation trends
Social inflation and third-party litigation funding remain core drivers of loss severity. Courts are continuing to produce nuclear verdicts, particularly around human trafficking, liquor liability, A&B, drownings and security-related claims. Some states, including Alabama and South Carolina, have introduced liquor liability tort reform, allowing carriers to re-evaluate their risk appetite and potentially re-enter these markets with more favorable terms.
Technology & AI
AI tools are becoming indispensable for retail agents and brokers, helping produce cleaner submissions, more accurate valuations and reliable data verification, which can directly impact underwriting receptivity and pricing. In this environment, agents leveraging data analytics and automation to validate insured information stand out in the placement process.
Emerging risks
Human trafficking remains a hot-button issue, with increasing regulatory oversight and litigation activity prompting more mandatory exclusions. Liquor-related exposures are under renewed scrutiny, and carriers are rethinking their participation in entertainment-focused risks where liquor is more than 75% of total receipts.
Strategic renewal approach
In a soft property market with competitive pricing, differentiation is key. Retail agents should begin marketing early to secure optimal placement and terms.
Early engagement also allows for broader market access and the ability to strategically layer programs. Agents are encouraged to:
- Partner closely with brokers to define renewal goals and coverage priorities.
- Review valuations and coverage forms for accuracy and completeness.
- Leverage AI-supported submission tools for stronger presentations.
- Highlight opportunities to add back coverage that was restricted during the hard market.
- Maintain communication with insureds around risk management expectations, which can be a critical factor for favorable underwriting responses.
Insight provided by:
- Daniel Curran, SVP and Underwriting Officer, Amwins Program Underwriters
- Matt Janicki, EVP, Amwins Brokerage
- Brittany Mooney, Sr. Marketing Broker, Amwins Brokerage
- Joey Shapiro, EVP and Amwins National Hospitality Practice Leader
![]()
Public Entity
The public entity market has exhibited relative stability throughout 2025; nevertheless, certain challenges persist. Competition across many segments of the property market remains high as a result of increased capacity and accounts with large CAT footprints, loss frequency or severity still face stricter underwriting. In the casualty market, overall capacity remains stable, though pressure resulting from social inflation, litigation trends and ongoing shifts in legislation continues.
Property
The public entity property market is showing signs of continued softening, with more capacity coming online and increased competition across many segments. Large, shared and layered programs remain a focus. However, more carriers are targeting middle-market opportunities, offering products for smaller entities like regional school districts and municipalities.
Technology and AI are helping carriers handle higher submission volumes more efficiently, making it easier to write smaller accounts while at the same time resulting in more aggressive pricing and broader terms in the middle-market space. For larger public entities, purchasing decisions are still driven by budget rather than by market condition – keeping limits and retentions relatively consistent year over year.
For now, conditions generally favor insureds, though a significant catastrophe loss, especially in high-exposure areas like California, could shift the market quickly. Until then, healthy combined ratios, strong carrier appetite and increased capacity suggest the current softening is likely to continue in the near term.
Be on the lookout
- Public entity property buyers should be ready for continued capacity challenges, especially on larger schedules and in areas with high catastrophe exposure.
- Expect closer scrutiny on property valuations as carriers push for more accurate reporting and a greater focus on factors such as roof age and construction type, as well as mitigation and loss control efforts.
- Retail brokers should prepare insureds for the possibility that layered programs may become more common, even for accounts that previously relied on a single carrier.
Casualty
The public entity casualty market continues to navigate complex pressures driven by legal system abuse, escalating loss cost trends and shifting legislative landscapes. While overall capacity has stabilized compared to the peak of the hard market, underwriting discipline remains firm, particularly for high-severity exposures such as law enforcement, street and road design, and SAM claims arising from juvenile detention facilities and foster care programs.
Retailers and insureds face a marketplace where fewer carriers are willing to participate in the lead layer, line sizes are shrinking and excess participants are increasingly selective, requiring creative structuring and positioning to ensure comprehensive coverage.
Regulatory & litigation trends
Nuclear verdicts continue to be a significant driver of rising liability costs, particularly in law enforcement and transportation-related claims. These verdicts are increasingly fueled by third-party litigation funding which has intensified settlement pressure and made claims resolution more costly and unpredictable.
One of the more impactful developments for public entities has been the rise of reviver statutes. For K-12 schools, municipalities and counties, the consequences have been staggering. Los Angeles County, for instance, faced thousands of claims tied to foster care, juvenile detention facilities and educational institutions, resulting in a historic $4B settlement.
Another trend adding complexity is the migration of claims into federal courts through civil and/or constitutional rights violations. Incidents once contained within state courts, and subject to protective tort caps, are being pled as constitutional rights violations, bypassing state limitations altogether.
Alongside federal migration, there is increasing concern over the erosion of immunity protection. Novel legal theories, such as claims based on “failure to warn” or “gross negligence,” are increasingly being used to circumvent statutory defenses. The result is higher severity, broader exposure and a heavier reliance on experienced and specialized defense counsel, with insureds now collaborating in the filing of amicus briefs to mitigate adverse precedence and case law.
Emerging risks
- Transportation & transit risks are seeing an increase in the cadence of traumatic brain injury (TBI) claims, driven by more aggressive litigation tactics and plaintiff-friendly medical narratives.
- Municipalities are facing greater liability tied to crowd control, policing strategies and ICE-related activity.
- Difficulty recruiting and retaining bus drivers, jail staff and law enforcement personnel continues to strain operations, leading to more frequent claims.
Technology & AI
AI and advanced analytics are emerging as valuable tools for managing casualty risk. Public entities are using predictive modeling to spot high-risk exposures and take preventive action. Law enforcement is using AI to review body camera footage and incident reports, which helps flag problematic trends in officers before a claim arises. Municipalities are also using AI-enabled surveillance systems that can detect weapons and other threats in real-time.
On the claims side, carriers are using AI to assess reserve adequacy, validate data and improve pricing accuracy, helping to create a more informed and efficient underwriting process.
Professional lines
Cyber liability
While claims have not slowed, we have not yet seen rate increases across the board. Cybersecurity underwriting requirements are consistent among carriers, and the appetite for cyber liability remains stable.
We have seen a tightening in the market for larger risks (e.g., pools and joint purchase agreements). Underwriters continue to focus on e-crime and social engineering, and while there is a growing interest in AI, endorsements for this type of coverage are just beginning to develop.
The number of carriers offering higher limits is contracting. Carriers are evaluating their exposure, narrowing their appetite and competing in areas only where they are most interested.
Public official, crime and fiduciary liability
Package and program carriers offering blended professional and general liability coverage with property coverage are reducing limits and, in some cases, eliminating certain types of coverage altogether. Coverage for public official and employment practices liability is a particular focus, as are fee suits exclusions and sublimits for fiduciary liability.
As these key coverage and dedicated limits grow, we have seen an increased focus on standalone policies. Capacity for these policies has opened up; the limits aren’t large, but the coverage is competitive where available. Pricing is sustainable and retentions are often reasonable.
We have seen an increase in interest from insureds when it comes to choice of counsel. Boards are largely driving this discussion, with a desire to partner with counsel that knows and understands the entity rather than work with a litigator chosen by the carrier. Carriers have been flexible, especially with marquee accounts, while others are offering rate caps and making selection of counsel subject to their approval.
Underwriting
Underwriting in the public entity space remains selective and highly dependent on jurisdiction, with many long-standing markets holding firm despite growing competition. While some newer players are taking a more aggressive approach, established carriers continue to be selective, especially on higher-exposure accounts.
Capacity is tightening and $10M limits are becoming increasingly rare outside of legacy placements. For new business, most carriers now cap their participation at $5M or less, and several have signaled plans to phase out existing $10M commitments. As a result, buyers looking for larger towers often need to spread coverage across more markets or take on higher retentions to reach the same overall limits.
Regional and exposure-specific challenges
Geography continues to heavily influence underwriting decisions. California remains one of the most challenging environments, driven by rising claims cost, social inflation and ongoing impacts from AB 218 and other reviver statutes expanding the window for SAM claims.
New Jersey and select Northeastern states are experiencing similar pressures, with carriers particularly cautious on K-12 school exposures. On the West Coast, Washington is difficult due to the absence of meaningful tort caps, resulting in claim costs often several multiples higher than comparable exposures in Oregon, where strong, inflation-adjusted tort caps provide more stability.
Pricing trends
While rate pressures have eased when compared to the peak of the hard market, underwriting remains firm. For clean accounts, average increases are typically 4% to 6%, but accounts with losses often face much higher jumps, sometimes more than 20%, depending on the jurisdiction and claims history. Pools and larger programs are seeing more variation, with many averaging increases of 8% to 10%, even when carriers aim for lower targeted increases.
Historical pricing inadequacies are still being corrected and carriers continue to rely heavily on credible, recent loss experience when making decisions. Where 10 years of loss history used to drive pricing models, many underwriters are now focusing primarily on the most recent three to five years, which has amplified increases for accounts with emerging or deteriorating trends.
Be on the lookout
- While significant changes to core coverage terms remain uncommon, underwriters are consistently tightening conditions around retentions, deductibles and higher layers, especially for accounts with deteriorating loss experience.
- In larger programs, carriers are increasingly requiring SIRs be recalibrated upward if they haven’t been adjusted in several years, citing rising claim costs and inflationary pressures.
Insight provided by:
- Wil Cooper, EVP, Amwins Brokerage
- Susan Flemming, EVP, Amwins Brokerage
- Brian Frost, EVP, Amwins Brokerage
- Ali Hoefle, VP, Amwins Brokerage
- Russell Jackson, VP, Amwins Brokerage
- Darron Johnston, EVP, Amwins Brokerage
- Andrew Kay, President, ASCS
- Stacy Kaplan, EVP, ASCS
- Michelle Tagge, SVP, ASCS
- Ryan Telford, EVP, Amwins Brokerage
- Dave Weller, EVP, Amwins Brokerage
- Casey Withers, SVP, ASCS
![]()
Real Estate
Casualty Market Overview
The real estate casualty market remains challenged by rising loss development, fueled by both an increase in claims going to trial and escalating litigation costs. Rates continue to rise (often by 10% or more) across both primary and excess placements. At the same time, the number of excess limits carried by insureds continues to decline as costs climb and underwriting discipline remains tight.
California continues to see rates firm as a result of systemic legal challenges and nuclear verdicts, while other regions are seeing modest stabilization. Some additional capacity has entered the primary GL space, though much of it comes with the same restrictive terms already present in the market.
Competition is intensifying, particularly for clean schedules and smaller portfolios under 1,000 units. Buyers are increasingly prioritizing rate over coverage enhancements, creating a price-driven environment where carriers are aggressively pursuing high-quality risks.
SPFM continues to provide stability by focusing on disciplined underwriting and avoiding volatile CAT exposures.
Coverage limitations and underwriting trends
Underwriters are taking a closer look at submissions, with seven years of loss runs being the more typical number of years requested versus five. Many carriers are declining to quote portfolios that carry multiple GL policies (e.g., one policy per location), preferring consolidated placements that provide a clearer loss picture. However, consolidating policies onto a master policy remains challenging.
For accounts with sublimits on specific exposures, such as A&B or firearms, brokers are increasingly turning to stand-alone carriers to bridge gaps.
Obtaining a lead $5M limit remains difficult for larger or more complex risks, with most carriers capping at $2M to $3M. Additionally, firearms exclusions are appearing more frequently across schedules, marking a shift from prior years.
Market dynamics
Economic impacts
Social inflation and third-party litigation funding continue to fuel nuclear verdicts, especially in California, driving up casualty costs and placing pressure on rate adequacy. While tort reform measures in Florida appear to be reducing frivolous litigation, any meaningful impact to the E&S market may take time. Georgia has passed similar reforms, and the industry remains cautiously optimistic about long-term benefits.
Rising construction costs and broader economic inflation are also affecting replacement cost valuations, increasing the importance of maintaining adequate limits and regularly reviewing coverage adequacy.
Technology & AI
AI is beginning to streamline underwriting and improve efficiency across the real estate sector. Underwriters are using it to aggregate and analyze data more effectively, allowing for faster evaluation and decision-making. The ability to “scrub” large SOVs using AI tools has significantly accelerated the submission and quoting process.
Emerging Risks
Habitability claims, once largely confined to California, continue to surface in other states, signaling a growing concern for property owners with geographically diverse portfolios. Insureds should be mindful of varying state-specific exposures and compliance standards.
Lenders, particularly Fannie Mae and Freddie Mac, continue to impose stricter insurance requirements, including higher A&B and abuse limits, lower retentions and additional excess coverage. These evolving demands are creating ongoing challenges for insureds and brokers alike.
Be on the lookout
- Expect continued evolution in mono-line A&B markets, with new carriers entering to address sublimit needs.
- Ongoing competition for smaller, well-performing portfolios, even as underwriting discipline persists.
From our underwriters
While markets are showing signs of competitiveness, particularly where CAT activity has been muted, underwriters continue to face growing pressure from social inflation, aging infrastructure and evolving regional exposures.
Regional trends
Southern California remains a dominant concern due to escalating wildfire exposure. The 2025 LA wildfires, projected to be the costliest in U.S. history, have reinforced the need for disciplined CAT management and risk selection. In casualty lines, California continues to see minimum 10% rate increases driven by legal pressures and nuclear verdicts, while other regions remain relatively stable.
SPFM’s West Coast focus, excluding high-CAT areas such as Colorado and New Mexico, positions the team to serve best-in-class assets like apartments, condos and LROs with no wildfire exposure. Through collaboration with carriers, SPFM has also secured rate reductions of up to 12.5% for 1980s and newer wood-frame properties—an important differentiator in today’s environment.
Technology & AI
Technology remains central to underwriting evolution. Carriers and MGAs are leveraging AI to streamline operations, using it to read inspection reports, pre-qualify submissions and, in some cases, assist with form review. While this enhances efficiency, it can introduce new E&O risks as automation and AI reliance increase.
Challenges
Underwriters are navigating increased submission volume and tighter terms, especially for habitational business. Violence-related claims have risen sharply, driving large payouts and reducing available capacity in the excess liability market. In states like Georgia, surging crime rates have led to significant losses under A&B coverage, which in turn have rapidly depleted available capacity in the excess liability market.
Social inflation continues to fuel nuclear verdicts, with bodily injury claims now accounting for roughly half of total indemnity. Claims are taking longer to resolve, pushing defense costs higher and driving limits to exhaustion at $5M, $10M, and $15M levels. Tort reform efforts aimed at capping liability and medical expenses have yet to provide meaningful relief.
In the D&O segment, aging infrastructure has added another layer of concern, with many buildings from the 1970s and 1980s now requiring significant repairs to meet updated safety standards. Following the Champlain Towers tragedy, new legislation has increased scrutiny on structural integrity, leading to higher assessments and, in some cases, lawsuits against prior board members for deferred maintenance.
Be on the lookout
- While no sweeping exclusions have emerged, wildfire-related underwriting scrutiny is intensifying. Insureds should expect more documentation requirements and greater emphasis on risk mitigation measures. Ongoing pricing volatility, particularly in property lines.
Real estate developers
The real estate developers (REDs) E&O market continues to evolve as new carriers enter the space, creating healthy competition that’s driving down rates and broadening coverage.
Capacity and pricing
Over the past year, several markets have introduced dedicated RED products, reflecting increased carrier interest and capacity in this long-discussed segment. As a result, pricing has become more competitive, with broader policy terms that now include full limits protection, rectification coverage and expanded pollution protection. This covers transportation, notices of default and more. Some markets have also removed faulty workmanship exclusions, adding further value to insureds. This influx of new players is largely driven by the broader E&O market’s competitive nature, pushing carriers to diversify and seek opportunity in emerging or previously underserved niches like REDs.
Coverage limitations and underwriting
Despite these positive developments, underwriting remains nuanced. Some of the newer forms on the market don’t adequately address risks tied to construction services, particularly when work is performed in-house or subcontracted. This gap highlights the importance of partnering with a broker who understands each carrier’s appetite and form structure. Communicating these distinctions to clients will be key, as not every product is suitable for every type of development operation.
Insight provided by:
- Elvira Acosta, EVP, SMIC
- Corey Alison, EVP, Amwins Brokerage
- John Cleary, Advisor, Amwins Brokerage
- Chris Murphy, EVP, Amwins Brokerage
- Matt Sheehan, EVP, Amwins Brokerage
- Veraliz Castro-Williams, COO, Kevin Davis Insurance Services
- Augie Yost, VP, Amwins Brokerage
![]()
Transportation
The transportation marketplace remains challenging. Insureds’ operating costs have continued to rise while freight rates and revenues have remained relatively stagnant. This is particularly true for trucking, where the impact of import tariffs and recent federal regulation changes are still largely unknown.
Capacity and pricing
Commercial auto is seeing double-digit rate hikes across the segment as most carriers continue to see losses driven by social inflation, third-party litigation and the increased cost of claims handling. While there are pockets of stability in preferred territories and classes of business, the reinsurance marketplace has been seeking higher rates in traditionally more difficult territories and classes. We’re also seeing fewer new market entrants than in years past, resulting in limited capacity.
In the business auto segment, standard carriers continue to evaluate the performance of their auto portfolios with many non-renewing package offerings. This has led to insureds seeking monoline solutions in the E&S specialty classes. Additionally, hired and non-owned auto has been a difficult exposure for carriers to underwrite, either not being offered or driving significant premium. There is also inadequate market capacity for certain classes, including dump operations, non-emergency medical and drive-away. This has resulted in rate increases beyond inflationary levels.
Trucking
Overall, the market wants stable, more predictable insureds. Accounts with seasonal drivers and/or high driver/vehicle turnover are being hit especially hard, including accounts focused on dumping related risks. Trucking accounts that can present stability, coupled with quality loss history and safety scores, are typically seeing a competitive marketplace as there is still adequate capacity for preferred trucking.
The preferred trucking space has seen increased competition as tolerance for distressed characteristics continues to tighten and carriers battle for market share on preferred risks. Many operations that are currently ineligible for preferred consideration have turned to captives and other alternative risk transfer products as a solution.
Despite what can only be called a challenging market, we remain optimistic that freight rates will improve due to the number of motor carrier exits as supply and demand for freight capacity equalizes.
Market dynamics
Regional trends
With the high cost of reinsurance, worsening loss performance and program exits, it’s becoming increasingly more difficult to find capacity for accounts in coastal regions. The underwriting appetite in the Southeast is also making it incredibly difficult to write accounts with less than five to six years of experience. Accounts with any losses – regardless of size – are challenging as underwriters have become more concerned with the frequency.
States like New York, California, Texas and Illinois continue to see limited active players, and the casualty marketplace in New Jersey is essentially non-existent due to high-frequency claims and the increased limit requirement of $1.5M. We expect insureds will continue to reduce both the number of units and drivers due to the increase in cost.
It’s not all bad news. Several startups are emerging in the inland marine space as it has traditionally been a profitable (but small) segment of a carrier’s business.
Technology & innovation
Increased underwriting scrutinization has resulted in many carriers relying on policy structures that require insureds to maintain and share electronic logging device (ELD) and telematics data for the full policy term. As a result, we have seen growing investment in safety technologies and the data they provide, helping both fleet owners and underwriters better understand and manage risk, improve safety and potentially result in better terms.
You can learn more about telematics and the protection they help provide insureds here.
Technology and AI can help boost efficiency. Underwriters with access to online products typically have the advantage because they can provide quotes and issue policies quickly. They can also be more adept at account review (e.g., determining the radius of operations and mileage) and decision-making.
London
Domestic markets in the U.S. are packaging auto physical damage (APD) and motor truck cargo (MTC) coverages with auto liability, offering reduced rates and causing a downturn in the London Market. As a result, capacity for APD and MTC within Lloyd’s and London remains plentiful.
Property markets are also looking at APD and MTC as it is short-tail business without the requirement for re-insurance. London is seeing higher limits on MTC, which can reduce the requirement for small excess layers.
Additionally, some markets have begun to offer non-truckers’ liability, packaging it with APD to appeal to those who may not want to purchase a separate policy. We’ve also seen higher limits on excess coverage and towing.
Be on the lookout
- Freight forwarders, transportation brokers and other third-party logistics providers are pushing for coverage on contingent cargo exposures as global supply chains become more complex and volatile. Additionally, as regulatory environments shift and technology is more widely adopted, we are seeing new errors and omissions exposures.
- We’ve seen everything from falsifying documents to sophisticated hacking of tracking systems with bad actors infiltrating the system and recreating correspondence between a dispatch and a shipper or consignee.
- Drivers that are unable to demonstrate the state required levels of English proficiency may receive out-of-service violations – regardless of their overall driving record. We have seen this play out in California, Florida, Illinois, New Jersey and Texas, particularly.
- While several small electric local delivery trucks have gone electric, the distance heavy goods vehicles must travel eliminates the use of most electric batteries. As a result, we believe these vehicles will not be fully implemented into big rig trucking companies anytime soon.
Insight provided by:
- Tracy Andrews, VP, Amwins Brokerage
- Jason Baynard, SVP, Amwins Program Underwriters
- Nick Blankenship, Sr. Underwriter, TUMI
- Zach Bowling, EVP, Amwins Brokerage
- Stephen Carter, Director, Amwins Global Risks
- David Edgerton, Director, Amwins Global Risks
- Jon Humphreys, Managing Director, Amwins Global Risks
- Joseph Krieg, AVP, Amwins Brokerage
- Dan Litterio, SVP, Amwins Brokerage
- Brandon Phillips, Underwriter, Amwins National Transportation Underwriters
- Sara Rodriguez, Underwriter, Trinity Underwriting Managers
- Adam Wood, SVP, Amwins Brokerage
- Craig Wren, Director, Amwins Global Risks
![]()
Agriculture
Securing comprehensive insurance coverage for ag-related risks has become increasingly difficult as the industry faces an insurance market shaped by rising prices, reduced limits and mounting underwriting scrutiny. While property markets have softened amid increased competition, casualty has only grown more challenging, with underwriters pulling back on limits and tightening terms. Product recall continues to remain stable despite the industry facing several newsworthy recall events in the last year. Retailers and insureds alike are finding that even familiar renewals require more strategy, more detail and, often, more compromise.
Capacity and pricing
Property
There has been an uptick in new primary entrants in the E&S agriculture market, with more options emerging for accounts that previously had few viable landing spots. With the influx of new entrants, the primary property market has softened considerably, with competition driving down rates and carriers expanding their appetites for certain risks. However, premiums remain high, often with $25,000 minimums, and coverage is often far from comprehensive.
London markets, particularly in the stock throughput space, continue to adjust downward, offering more creative solutions such as coordinated deductibles and profit commission clauses to stay competitive. There are many new domestic primary entrants into the agriculture market as the carriers continue to diversify their portfolios away from CAT-driven real estate exposures. As a result of the additional capacity and competition, property rates have fallen.
Casualty
Casualty, however, tells a very different story. In what many thought would be a plateau year for the excess casualty market, pricing has continued to rise and capacity has become even more constrained. Several recent renewals have shown limits being slashed mid-tower, with $10M lines being cut to $5M or less, forcing brokers to stitch together placements through creative quota shares. It's not uncommon to see multiple markets splitting a $10M layer just to get a deal done.
Coverage limitations and underwriting
These pressures are especially evident on the casualty side, where heightened underwriting scrutiny continues to narrow available coverage. Brokers are seeing a significant increase in underwriting questions, particularly around auto exposure, food handling and third-party contracts. Haulers and sub-haulers are a hot-button issue, with many insureds lacking formal agreements or risk transfer protocols on those third-party contracts.
Applications that once focused on revenue, fleet size and crop types are now accompanied by full HNOA supplements and in-depth questionnaires. Carriers want to know whether the operation touches the product directly, how close it is to contamination risks and whether food safety protocols can withstand a major outbreak or recall.
On the property side, while capacity has improved, some coverage limitations persist. Carriers continue to push actual cash value settlements on older roofs, apply percentage wind or hail deductibles, and in some stock throughput placements, still attempt to exclude spontaneous combustion, often one of the largest exposures for agriculture operations.
Market response: avian flu and foodborne illness
The ongoing bird flu outbreak has reverberated across underwriting for agriculture, especially for accounts tied to raw milk or live poultry. Large losses, including multiple limit hits on certain dairy and raw milk accounts, have led to more scrutiny and underwriting detail being required. Retailers looking to cover avian flu risk have increasingly turned to captive structures, highlighting just how limited the traditional insurance market has become in this area.
The rise of communicable disease exclusions has also become an area of concern. While court decisions have not yet resulted in food-to-person transmission becoming an exclusion under standard communicable disease wording, many carriers continue to rely on broad exclusions that significantly limit recovery in the event of a foodborne illness claim. On a positive note, this has opened the door for well-structured forms with disease give-backs to win business, especially as policyholders realize just how much coverage can be eroded by unchecked exclusions.
Market dynamics
Economic factors
Economic inflation continues to push sales figures up for agriculture clients, but rating methodologies don’t always reflect the true risk. Even massive ag operations with $200M to $300M in sales may be rated at less than $1.00 per thousand on the primary layer, a rate structure that appears out of sync with the risk profile. Helping to inform and educate underwriters on an insured’s exposure, especially around food safety and distribution, has become essential for brokers trying to achieve rate adequacy without overcharging their clients.
Insureds will likely see economic impacts from tariffs and inflation on the surplus lines side as receipts are often used as a factor in premium rating. Even if the number of units/output remained consistent in prior years, sheer product sales are likely to increase, resulting in a higher rating.
Emerging risks
Pollution is a commonly overlooked risk in the agricultural marketplace. Many general liability policies coming off standard market agriculture packages are missing key coverages for ag spray, overspray and adjacent property damage. As a result, adding standalone contractor's pollution liability policies has become more common, especially for operations that apply chemicals on their own or neighboring fields.
Emerging risks like drone spraying are also beginning to complicate the market. While drone use has expanded from aerial mapping to actual chemical application, insurance solutions have not kept pace. Aviation markets typically cap chemical application liability, and many GL markets don’t want the exposure at all, leaving policyholders to piece together drone liability with separate pollution policies for overspray.
On the human capital side, labor remains a concern. While migrant labor programs continue to support harvesting seasons, increasing scrutiny around documentation and immigration enforcement could introduce new hiring risks. Some insureds are unable to verify licenses or insurance for workers driving their vehicles, a growing problem when trying to secure hired and non-owned auto coverage.
Strategic renewal approach
The new Amwins PRMA Ag Facility, launched on July 1, 2025, focuses on the swine and cattle industries, segments where retail direct markets have faced challenges due to convective wind losses. This new solution expands capacity and provides tailored support for a market segment that has seen limited options in recent years.
Navigating the agriculture market today requires diligence, creativity and a commitment to education, both for clients and underwriters. Retailers should be prepared to deliver detailed submissions with full supplements, clear risk transfer plans and a thorough understanding of the insured’s operations. The growing reliance on quota shares and the sharp focus on auto exposures demand more strategic structuring, especially on excess placements.
Most importantly, retailers must read the forms — all of them. From communicable disease exclusions to hidden gaps in food liability or consumption carve-outs, the details matter more than ever. With rates staying high and capacity continuing to shrink, ensuring the coverage matches the exposure has never been more critical.
Be on the lookout
- Lead time is important when building an excess tower, especially with large fleets or for those insureds who have had larger losses.
- Carriers are asking for more detail on driver and fleet safety info, as well as food safety and testing procedures.
Insight provided by:
- Elliot Martin, EVP, Amwins Brokerage
- Jen Oshita, SVP, Amwins Brokerage
- Lindsay Williams, EVP, Amwins Brokerage
![]()
Cannabis
The cannabis insurance market enters 2026 in a position of relative stability. Market conditions remain largely unchanged from 2025, characterized by abundant capacity, soft pricing and cautious underwriting discipline. While the regulated cannabis segment shows signs of finding its pricing floor, emerging exposures—particularly tied to hemp-derived THC beverages—are reshaping risk considerations across hospitality and manufacturing sectors. Regulatory uncertainty persists at the federal level, but innovation in specialty coverage continues to advance the industry’s maturation.
Capacity and pricing
Capacity remains ample across the sector, particularly for small to mid-sized operators. The majority of placements continue to flow through program structures supported by hybrid fronting carriers. Market conditions have also stayed the course and continue to be soft, with several new programs launched in 2025 sustaining downward rate pressure.
Select classes, such as indoor grows using HPS lighting or risks in high-crime areas, continue to experience localized tightening. Casualty rates remain lower than in most other P&C segments, though mounting product liability and false advertising claims suggest the market may be approaching its floor.
Coverage limitations and underwriting
While a trend towards broader forms has been long-standing, reinsurance pressures have reversed course. Many carriers have implemented more restrictive health hazard and specified disease exclusions to maintain reinsurance support, resulting in increased variability in terms across the market.
Standalone E&S carriers continue to provide the most comprehensive product liability solutions, while program markets remain narrower in scope. Retail agents should carefully review non-ISO policy forms as exclusions are not always disclosed at the quote stage, and aggressive pricing can mask material coverage gaps.
Market dynamics
Regulatory & litigation trends
Federal rescheduling of cannabis from Schedule I to Schedule III remains the most significant potential catalyst for market expansion. Rescheduling would likely reduce tax burdens for cannabis businesses and could attract additional carrier participation and capital. No formal action has been taken to date, though regulatory discussions remain active.
Litigation is intensifying, with increasing product liability and psychosis-related claims tied to high-potency vape products. These cases often involve allegations of unlawful marketing and sales practices, testing the scope of coverage under existing policies.
Technology & AI
Technology integration across cannabis operations continues to evolve gradually, with modest gains in automation, tracking and compliance tools. AI applications in underwriting and risk management remain limited, constrained by inconsistent operational data across the industry. No major technology-driven disruption is anticipated in 2026.
Emerging risks
The rapid rise of hemp-derived THC beverages represents the most transformative trend within the cannabis marketplace but enters 2026 under a cloud of uncertainty. Federally legalized by the 2018 Farm Bill, these intoxicating products have gained mainstream traction as they are sold in major retail outlets as well as served in bars, restaurants and entertainment venues. The category’s expansion introduces new exposures for hospitality, manufacturing and distribution clients.
However, the spending bill passed by Congress in November 2025 redefined hemp products as containing a maximum of 0.4 milligrams of THC per container, making virtually all hemp-derived THC products Schedule 1 narcotics effective November 12, 2026. The industry is lobbying Congress to enact comprehensive regulations in lieu of the ban, and operators remain optimistic that lower dose products have a viable future.
Traditional GL and liquor liability policies exclude cannabis impairment, creating a substantial coverage gap that can be filled via Impairment liability policies, currently available via limited markets. Even if the ban is enacted as scheduled, businesses selling or serving THC beverages have an active exposure that may trigger liability for years to come.
Be on the lookout
- Ample capacity and aggressive competition continue to place downward pressure on renewal pricing. Retailers should prioritize coverage quality over rate savings, particularly as some new entrants rely on narrow reinsurance or impose restrictive exclusions.
- For clients expanding into hemp beverages or hospitality service, early dialogue with underwriters is critical to help ensure appropriate impairment liability coverage. Retailers should proactively educate insureds on emerging exposures and verify policy language to safeguard against undisclosed limitations.
Insight provided by:
- John Deneen, Program Manager, Amwins Program Underwriters
- Norm Ives, Cannabis Practice Leader, Amwins Brokerage
- Jeff Katz, SVP, Amwins Brokerage
![]()
Crypto
As digital assets continue to mature and integrate into traditional financial systems, the crypto insurance market is evolving in parallel. While institutional adoption and infrastructure growth signal long-term stability, recent carrier exits and valuation shifts have reshaped the segment’s risk profile heading into 2026.
Capacity and pricing
Market participation in the crypto segment continues to contract, with several carriers exiting the class after adverse loss experience. Remaining capacity is largely concentrated among a few carriers.
Despite fewer market participants, limits of $30M to $50M are generally achievable without layering, largely due to declining insured values. Accounts that once carried $100M+ in TIV are now closer to $30M, as the cost per miner has fallen sharply over the past several years. Pricing has stabilized, reflecting improved underwriting discipline and moderated market volatility.
Coverage limitations and underwriting
Coverage breadth remains narrow, particularly for equipment breakdown (EB) and business interruption (BI) coverage.
A notable underwriting issue is valuation methodology. Some inland marine forms continue to value mining equipment at ACV, even when insureds report replacement cost values on their statements of value. This misalignment has led to unfavorable claim outcomes and remains a key negotiation point at renewal.
Market dynamics
The crypto property market has seen some premium relief as a result of softening rates and the entry of new participants, particularly on larger shared and layered programs. However, only a limited number of carriers are willing to write full property programs, and deductibles are often set high to deter frequent attritional claims. Coverage typically includes sublimits for electronic equipment, BI and breakdown, while exclusions remain standard for crypto asset value fluctuations and certain cyber-related losses.
At the same time, broader financial trends continue to normalize the crypto market. Institutional investors, ETFs and financial institutions are increasing their exposure to digital assets, and forecasts for 2026 are split between a moderated cycle and the potential for new highs driven by institutional demand.
Infrastructure investment continues to expand, particularly in data centers that incorporate crypto hosting and mining operations. Many of these new builds also include renewable energy components, such as solar arrays and battery storage systems, which power mining operations. Integrating digital asset operations with energy generation introduces additional underwriting complexity, particularly around fire protection, operational safety and asset segregation.
Colocation of crypto and energy assets remains a challenge. While larger, well-engineered risks with clearly separated operations can often be placed through separate energy and crypto panels, middle-market accounts with combined exposures have found coverage more difficult to secure due to varying carrier appetites. Some markets maintain strict exclusions for properties located near crypto facilities because of fire risk.
Crypto mining
Structuring property insurance for crypto mining remains complex. Traditional programs are challenging, as primary and excess markets are reluctant to deploy large limits and coverage often excludes business interruption tied to crypto valuations. Captive insurance approaches can address some of these gaps by funding deductibles or aggregate losses and providing access to reinsurance markets beyond traditional carriers. Captives also enable custom coverage, such as equipment breakdown or downtime linked to power outages.
Parametric insurance solutions are increasingly used, triggering coverage based on objective metrics such as temperature, power outage duration or grid frequency. These products can provide quick payouts without loss adjustment disputes and complement traditional property insurance. Shared and layered towers remain another approach, where multiple insurers or reinsurers participate across property layers, and captives may take a quota share to increase insurer confidence, facilitating the building of capacity up to hundreds of millions.
Business interruption
BI coverage in the crypto space faces notable limitations. Insurers typically exclude revenue tied to cryptocurrency price fluctuations, with coverage generally restricted to gross earnings from operations rather than crypto market movements. Captive programs can provide tailored BI coverage linked to power uptime or mining throughput, while parametric coverage can deliver lump-sum recovery for outage-based downtime, offering an alternative to traditional BI solutions.
Strategic renewal approach
Policyholders should expect heightened scrutiny of valuation, form language and loss prevention controls. Early engagement with markets offering EB/BI capacity is critical, as these options are limited. Brokers can improve placement outcomes by emphasizing operational transparency, robust engineering reports and proactive loss control measures, especially for accounts that blend energy and crypto operations.
Be on the lookout
- Continued institutional investment may drive new capital inflows into the crypto sector.
- Growth in colocated energy and mining operations could prompt more cross-sector underwriting collaboration.
Insight provided by:
- Christen Sawyer, AVP, Amwins Brokerage
- Patrick Park, EVP, Amwins Brokerage
![]()
Cyber
The cyber insurance market remains in a competitive phase, characterized by abundant capacity and modest rate pressure. While pricing has continued to soften, many in the market believe we’re nearing a bottom as claims activity trends upward and carriers begin to show more underwriting discipline, particularly on sensitive classes like healthcare.
Capacity and pricing
Capacity remains plentiful, with competition from both established and new entrants continuing to drive rates down or hold them flat. The level of competition often depends on how aggressively programs were priced the prior year, with some markets still viewed as overpriced relative to coverage scope.
Carriers are increasingly willing to enhance terms at little or no cost, including higher sublimits for social engineering, invoice manipulation and funds transfer—sometimes up to $500,000 depending on class and premium. Breach response and defense costs outside the limits are also becoming standard. While some underwriters are testing modest rate increases, competition quickly curbs those efforts, keeping overall pricing conditions favorable for insureds.
Coverage limitations and underwriting
Coverage differentiation remains a key focus as new exclusions and wording updates continue to emerge, creating a more conservative approach to underwriting. Carriers have broadly adopted “wrongful or unlawful collection” and “pixel tracking” exclusions in response to privacy litigation tied to web tracking and data collection practices. These exclusions are especially impactful in healthcare, manufacturing and other data-intensive industries.
Social engineering coverage continues to vary widely, with inconsistent requirements around verification controls, ownership of lost funds and coverage for tangible goods. Retailers should pay close attention to callback provisions, reimbursement versus “pay on behalf of” language and breach response limits, all of which can materially affect claims outcomes.
Market dynamics
Regulatory & litigation trends
The volume of privacy-related litigation continues to rise, driven by state-level privacy laws such as the California Consumer Privacy Act (CCPA) and the California Privacy Rights Act (CPRA). The application of wiretapping statutes to online data collection has created new coverage challenges, while third-party litigation funding continues to amplify claims frequency and cost.
Technology & AI
AI continues to shape both sides of the cyber market. On the risk front, it’s enhancing the sophistication of social engineering, phishing and deepfake attacks. On the underwriting and placement side, tools like Amwins’ AI-powered Coverage Comparison feature will enable brokers to more easily identify and communicate key coverage distinctions to clients.
Strategic renewal approach
As rates stabilize, the focus for retailers should shift toward quality of coverage, claims responsiveness and carrier partnership. While lower-cost options remain abundant, insureds benefit most from working with carriers that bring meaningful cyber claims experience and technical expertise.
Retailers are encouraged to leverage Amwins IQ and Cyber+ to strengthen submissions and differentiate renewals. Cyber+ provides expanded protection for social engineering and invoice manipulation—offering up to $500,000 in limits, twice the market standard—with diversified, A+ rated carrier backing.
Be on the lookout
- Potential shift toward greater underwriting discipline is expected mid-2026 as pricing plateaus.
- Expansion of privacy-related legislation at the state level, influencing coverage terms could impact the 2026 marketplace.
- The continued use of benchmarking and AI-powered comparison tools will help support renewal negotiations.
Insight provided by:
- Matt Donovan, EVP, Amwins Brokerage
- Matt Shanks, EVP, Amwins Brokerage
- Megan North, EVP, Amwins Brokerage
![]()
Habitational
The habitational property market remains soft, driven by an influx of new capacity, particularly from MGAs eager to deploy capital. With another quiet year for natural catastrophes, competition has intensified, pushing pricing and deductibles down while broadening coverage terms. In many cases, decisions are being made on dollars rather than underwriting discipline, as both surplus and direct markets compete aggressively.
Florida exemplifies the trend, where some direct markets are quoting at nearly half the cost of surplus carriers. Across the U.S., more non-CAT programs and Demotech-rated carriers are entering the space, while MGAs gain relevance through flexibility and capacity. The one area still showing resistance is wildfire, where rates remain firm and capacity selective. Overall, the lack of major CAT activity has created a “feast or famine” market, with some carriers expanding rapidly into new states to capture premium volume.
Coverage limitations and underwriting
Coverage continues to broaden as carriers look to differentiate themselves. Enhanced terms such as higher ordinance and law sublimits, extended service interruption distances and per-building or per-unit deductibles are now easier to obtain. Many carriers are also removing restrictive exclusions or offering embedded lower deductible options, blanket coverage and improved sublimits for flood, earthquake and wind-driven rain.
Valuations remain an underwriting priority, as inflation and labor shortages continue to influence replacement costs. Retailers are capitalizing on favorable conditions to negotiate full-value placements, loss limit increases and even multi-year rate guarantees. However, underwriting discipline is softening, with more last-minute unsolicited quotes and pricing determined largely by who gets the final look.
Market dynamics
Emerging risks
The market’s biggest short-term risk remains the potential for major catastrophe losses, particularly hurricanes or wildfires, that could abruptly reverse softening trends. The growing use of AI in underwriting and processing also introduces emerging professional liability exposures. Inflationary pressures and construction cost volatility remain ongoing concerns for valuation accuracy and replacement cost adequacy.
Strategic renewal approach
As capacity expands and pricing eases, the emphasis should remain on coverage quality over cost. Agents should communicate early with insureds, ensuring programs are properly structured with the right deductibles, limits, and terms.
While the current environment allows for broader coverage and lower rates, history shows that markets turn quickly following a major event. Maintaining a balanced, layered approach can help insulate insureds from sharp corrections when the cycle inevitably shifts.
Be on the lookout
- The current soft conditions could change abruptly if a significant hurricane or wildfire occurs, leading to rapid tightening in capacity and pricing.
- Increased reliance on AI in underwriting introduces new professional liability exposures, while inflation and construction cost volatility continue to challenge replacement cost accuracy.
Insight provided by:
- Jennifer Klassen, EVP, Amwins Brokerage
- Steve Knight, Head of Open Market, AGR
- Melissa Mears, EVP, SRU
![]()
Manufacturing
The manufacturing industry is entering 2026 with momentum across both property and casualty markets. Capacity remains abundant, pricing continues to stabilize and market appetite is broadening, particularly within the E&S segment. While high-hazard classes remain under scrutiny, expanded line sizes, targeted MGA programs and the adoption of AI-driven efficiencies are creating new opportunities for manufacturers and brokers alike.
Capacity and pricing
Capacity is readily available across most manufacturing risks, with MGAs and select carriers increasing line sizes and stretching primaries. Pricing remains competitive, especially on property placements where line sizes are growing and large commercial risks are benefiting from softer conditions.
Casualty markets remain relatively stable. Primary GL renewals are flat to slightly up, depending on exposure changes and loss experience, while the excess marketplace (particularly lead excess layers over large auto fleets) remains firm. Rate increases of 5% to 10% are common even on clean accounts, as carriers reduce capacity and require more participants to fill towers.
Retailers are still able to achieve favorable outcomes through full marketing campaigns, targeted submissions and strategic use of admitted capacity when available. Amwins’ Special Risk Underwriters (SRU) continues to expand its manufacturing appetite, providing tailored solutions for higher-hazard operations such as food processing, woodworking and recycling. Additionally, SRU’s sidecar has been instrumental in efficiently filling excess capacity as standard markets reduce available limits.
Coverage limitations and underwriting
While no major exclusions have emerged, underwriters remain disciplined, particularly for high-hazard or CAT-exposed manufacturing operations. Carriers are managing volatility by implementing higher deductibles, reduced limits and stricter terms and conditions.
In the food and beverage sector, it’s critical to review forms carefully, as microbiological and pathogen exclusions can create significant coverage gaps. Strong submissions with clear BI worksheets continue to help underwriters properly evaluate exposure and achieve appropriate risk transfer.
Market dynamics
Regulatory & litigation trends
Social inflation and third-party litigation funding continue to drive larger settlements and jury awards, especially for product liability and auto-heavy accounts. As these trends persist, manufacturers face higher premiums and increased scrutiny on loss history and safety practices.
Technology & AI
AI adoption is accelerating across the manufacturing landscape, supporting predictive maintenance, quality control and supply chain optimization. These advancements enhance efficiency but also introduce new exposures, particularly around cyber, product liability and technology-driven operational risk. Cyber liability coverage is becoming essential for manufacturers integrating smart systems and automation.
Emerging risks
Rising severity of convective storms and wildfire exposure continues to impact manufacturing facilities in CAT-prone areas, particularly in California as well as in the Midwest and the South. Economic inflation and supply chain volatility further pressure margins, replacement costs and business interruption values.
Be on the lookout
- We expect to see expanding E&S opportunities as standard markets retrench on food and beverage and higher-hazard classes.
Insight provided by:
- Kerry Anderson, AVP, Amwins Program Underwriters
- Craig Russell, EVP, Amwins Brokerage
- Cole Zalaznik, SVP, Amwins Brokerage
![]()
Marine/Inland Marine
Continuing the trend from last year, the marine market remains stable with signs of further softening across most lines. Several new entrants have added capacity, creating more competition and putting pressure on underwriters to quote lower rates compared to prior years. Carriers are becoming more aggressive, particularly within the cargo segment, where enhanced terms and expanded capacity have become increasingly common.
Capacity and Pricing
In general, hull and marine liability lines are experiencing a softening of rates. Although carriers are still seeking small increases on renewals, market pressure and competition have largely kept rates flat or slightly down.
Challenges persist in gap layers and umbrella placements involving heavy auto underlying schedules. Still, through strong relationships and access to both domestic and London markets, Amwins has been able to structure complex, high-limit programs successfully, a reflection of the broader re-engagement and appetite we’re seeing from London underwriters.
Cargo
Globally, marine insurance premiums reached nearly $40B in 2024, up approximately 1.5% from the prior year. Cargo insurance remains the largest sub-class, representing roughly 56.7% of the marine insurance book. Capacity has remained strong, with new entrants adding significant supply. Total USD capacity for cargo now exceeds 2017 levels, providing brokers with greater leverage in negotiations and contributing to the current competitive environment.
The cargo market is in a softening phase, though underwriters often describe it as “transitioning.” A surge in capacity continues to exert downward pressure on rates, a trend expected to persist into 2026. Current projections indicate that cargo and stock throughput program (STP) rates may decline by 10% to 20%, with stand-alone or excess stock placements highly sought after. Markets are offering competitive monetary stock deductibles, particularly in critical catastrophe-prone areas, reflecting both competition and careful risk selection.
Some key trends to be on the lookout for as we head into 2026 within the cargo market are:
- Continued softening of pricing with cargo premiums likely to remain under pressure, with moderate declines expected unless a major loss occurs.
- Underwriting discipline will have syndicates and MGAs focusing on terms, deductibles and loss experience despite abundant capacity.
- With geopolitical risks, shipping routes in the Red Sea and Black Sea remain a key area of concern, potentially impacting rates or capacity.
- Margin pressures causing soft rates may challenge profitability unless loss experience remains benign.
Recreational marine
In the recreational marine space, including marinas, boat dealers and rental operations, there has been little change over the past year. Most carriers continue to deploy smaller lines, typically between $2M and $5M, making it necessary to structure layered or quota-shared programs for accounts with higher limits, including CAT exposed, concentrated high value wet property (i.e., piers, wharves, docks, etc.).
These placements can be difficult due to limited market participation and competition from direct placements, stemming from the fact that many claims in this segment are non-marine in nature (e.g., slip-and-falls or restaurant-related incidents). As a result, leading underwriters to protect their books by maintaining smaller lines and tight capacity controls.
Workers’ compensation
Rates have continued to trend downward thanks to favorable performance and steady capacity. Unlike other liability exposures, social inflation has had minimal impact as indemnity benefits are tied to employee earnings and medical costs are governed by state fee schedules. As such, this space remains one of the most predictable within the marine sector.
Coverage limitations and underwriting
Underwriters remain cautious around exposures tied to geopolitical instability, especially in war risk zones, as well as climate-driven perils like hurricanes and coastal flooding. While war risk pricing remains somewhat unpredictable, overall rate levels are moderating.
The builder’s risk class is seeing renewed activity. Geopolitical unrest has driven military build programs worldwide, but there’s also been a rise in commercial shipbuilding as older fleets are retired and replaced. Owners face ongoing challenges in determining which fuel systems to install amid an evolving energy landscape, and even nuclear propulsion is reemerging as a consideration for long-range vessels.
In the hull market, some underwriters are offering longer-term policies (e.g., 24-month terms), a sign of a softening environment and an effort to lock in clients before further reductions occur.
MGAs continue to play a key role in shaping the London Market. While some represent returning capacity, most are redistributing existing capacity rather than expanding it. This dynamic has increased competition and contributed to rate softening, though pricing remains disciplined, a gentle easing rather than a full slide.
Market dynamics
Regulatory & litigation trends
While there have been no major regulatory changes directly impacting marine lines, broader insurance regulations around catastrophe exposure and reinsurance are influencing underwriting strategy. Carriers continue to focus on portfolio management and aggregation control in CAT-prone coastal areas.
Emerging risks
Geopolitical conflicts, including continued unrest in Eastern Europe and the Middle East, continue to shape the war market and shipping patterns. The growth of renewable energy and offshore wind projects has expanded demand for specialized marine coverages, from wind farm support vessels to cargo and contractor's equipment used in green energy construction.
Technology & AI
As autonomous vessel technology advances, underwriters are closely monitoring developments. While adoption remains limited today, these innovations will likely reshape the marine insurance landscape in the coming years.
Strategic renewal approach
The London Market has reasserted its presence in the U.S. marine sector, aggressively pursuing new opportunities and demonstrating strong appetite for cargo and stock throughput risks. Its renewed engagement, paired with expanded domestic capacity, is offering brokers and insureds more flexibility than the market has seen in years.
Amwins continues to leverage deep relationships across both U.S. and London markets to help clients navigate shifting conditions, identify creative placement strategies and secure comprehensive marine solutions in an ever-evolving global environment.
Be on the lookout
- We could see the rollout of new programs in 2026 as underwriters who moved into the market in 2024 build capacity and broaden appetite.
- Stable to declining workers’ compensation rates are expected due to strong performance and steady capacity.
- Increased underwriting caution around non-marine losses within recreational operations is likely.
Insight provided by:
- Patrick Jordan, Managing Director, Amwins Global Risks
- Toby Kayll, Managing Director, Amwins Global Risks
- Jack Miller, Director, Marine Cargo, Amwins Global Risks
- Tim Oster, SVP, AEU
- Ryan Riske, EVP, Amwins Brokerage
- Jenner Shaaber, Marketing Broker, Amwins Brokerage
Inland Marine
The inland marine market enters 2026 in an exceptionally soft position, mirroring the broader property market. Capacity is abundant, and competition among carriers is driving rate moderation and, in many cases, decreases. Underwriters are eager to retain and grow market share, offering more favorable terms such as lower retentions and broader coverage forms.
Across nearly all inland marine lines—builder's risk, contractor's equipment, motor truck cargo and warehouse legal liability—pricing trends remain flat to declining, particularly for profitable and well-managed accounts. For carriers, the challenge is holding deductibles steady to avoid excessive rate erosion. New entrants and startup programs have further expanded available capacity, intensifying competition.
Reinsurance renewals through mid-2025 were favorable, and early 2026 indications suggest flat to 10% to 15% rate reductions for loss-free property catastrophe layers, supporting continued appetite for primary capacity and marine schedule placements. Unless a major catastrophe or trade shock occurs, the soft environment is likely to persist through 2026.
Coverage limitations and underwriting
Although rates are softening, underwriting discipline remains a differentiator. Carriers are tightening wording around impostor carriers, double-brokering, misdirection and voluntary parting losses unless specifically bought back. Theft and fraud sophistication continue to pressure loss ratios, especially in hot spots like California, Georgia, Illinois, Tennessee and Texas.
Well-documented risk management and control measures can unlock better pricing and terms. For example, enhanced shipper verification, use of two-factor authentication for carriers and telematics adoption on contractor's equipment fleets are underwriting positives. Builder's risk placements also benefit from early submissions supported by catastrophe and water damage mitigation data.
Market dynamics
Regulatory & litigation trends
Social inflation and third-party litigation funding continue to impact claims severity, particularly in trucking and logistics. Carriers are increasingly factoring these costs into loss projections, even as competition restrains efforts to reflect those projections in rate.
Technology & AI
Technological innovation is impacting underwriting expectations. Telematics and AI-driven theft detection are being rewarded with credits and improved underwriting receptivity. On the insurer side, carriers capable of integrating real-time data and risk analytics are gaining a competitive edge in pricing accuracy and loss control.
Emerging risks
The rise of lithium-ion batteries and Battery Energy Storage Systems (BESS) introduces new fire hazards. These risks often trigger sublimits or require explicit safety protocols. Ongoing supply-chain volatility and cargo theft trends underscore the importance of proactive risk identification and mitigation.
Economic impacts
Inflation has always been a hot topic of conversation in the equipment and materials space. This is mostly driven by higher costs for materials, labor costs, shipping costs and equipment/component costs. As tariffs are imposed nationwide, we will continue to see upward pricing pressure on replacing equipment to like, kind and quality. We will also continue to see rising costs on shipping replacement parts from overseas, adding a significant time element on insureds and putting pressure on bottom line revenue.
Strategic renewal approach
In a soft market, differentiation matters. Retail agents should market renewals early and ensure that submissions highlight loss performance, theft-control technology and cargo-tracking systems. Insureds that document these measures are best positioned for continued favorable terms. Collaboration between agents, brokers and underwriters remains key to maintaining value and avoiding commoditization.
Stock throughput/inventory only
The stock throughput market has had an influx of additional capacity over the past year and continues to soften. As a result, we have seen significant rate reductions of approximately 10% for loss free renewal business. Alternative markets are available, potentially saving the insured up to 25%, depending on circumstances. Carriers are also allowing for greater autonomy, enabling underwriters to write more bespoke policies to fit the differing nature of an insured’s operation. Stock throughput coverage is historically wide, offering “all risk of physical loss or damage” coverage.
However, retailers have had success including sections of property coverage where the insured may be lacking coverage (e.g., fixtures and fittings, as well as business personal property). There has also been a flood of inventory only policies. These policies remove the stock from a traditional property placement and place it under a policy in the cargo market. Unlike a traditional property policy, it does not require transit coverage and simply provides coverage for inventory and stock when in store. This product can greatly benefit the insured as pricing and deductibles are often lower. Strategic renewal approach As the uncertainty surrounding tariffs continues, the pricing of products will as well. Stock throughput can allow for changes in value which gives an insured flexibility. Similarly, insureds focused on food products and pharmaceuticals are also facing potential risks of the U.S. Food and Drug Administration preventing goods from entering the United States due to changing regulations. A separate inventory only policy could help provide coverage for these clients.
Be on the lookout
- We expect tightened exclusions for theft, misdirection and impostor-carrier losses in 2026, coupled with a potential rate floor as carriers resist further erosion to protect margins.
- Underwriters may revisit limits and values more often to help ensure that they are capturing appropriate replacement cost(s).
- As we see downward pressure on pricing from new entrants into the market, premium adequacy may become more challenging for underwriters as claims inflation may erode profitability if the pricing keeps slipping.
Insight provided by:
- William Chadwick, EVP, Amwins Brokerage
- Heather Frain, SVP, Amwins Program Insurance Services
- Davis Holman, AVP, Amwins Brokerage
- Jack Miller, Director, Marine Cargo, Amwins Global Risks
![]()
Sexual Abuse and Molestation (SAM)
While the overall 2025 sexual abuse and molestation (SAM) insurance marketplace could easily be described as limited, the past few months have seen several new entrants to the monoline market. And there could be additional entrants in 2026 as changes are developing quickly in the space.
For now, capacity remains constrained. Admitted carriers continue to narrow their appetite, either reducing limits, applying heavy sublimits or excluding SAM altogether from general liability programs. Pricing remains elevated, with increases driven by growing claim severity, extended statutes of limitation and social inflation.
Insureds with high-risk operations such as education, social services and healthcare, continue to face difficult renewals and shrinking availability of affordable coverage. The result is an ongoing shift toward the E&S marketplace.
Coverage limitations and underwriting
Underwriters are applying greater discipline and scrutiny than ever before. Many GL policies now exclude SAM coverage entirely, while others offer only limited protection sometimes excluding physical abuse or restricting coverage to first-party-on-third-party claims. Comprehensive coverage that includes third-party-on-third-party exposure, which is crucial for organizations such as group homes, residential facilities and schools, is becoming increasingly rare.
In this environment, the strength of an organization’s abuse-prevention protocols can determine insurability. Carriers are requiring detailed evidence of hiring practices, staff training, supervision standards and incident-response plans. Organizations that can demonstrate consistent enforcement of these measures are better positioned to secure coverage and negotiate more favorable terms. Those without clear procedures or loss-prevention documentation are likely to face higher premiums, reduced limits or outright declination.
Market dynamics
Regulatory & litigation trends
Legislative reform continues to shape the SAM landscape, as numerous states expand or eliminate statutes of limitation for abuse-related claims. These changes allow historical incidents to be litigated decades after they occurred, introducing significant long-tail exposure for insurers and reinsurers. Carriers are responding by tightening policy language, adjusting aggregate limits and restructuring retentions, often shifting from per-perpetrator to per-victim formulations. The result is greater selectivity, higher pricing and a renewed emphasis on clear reporting and documentation from insureds.
Technology & AI
Although not yet a primary driver of underwriting, technology is increasingly part of the SAM risk conversation. Many organizations are incorporating AI-assisted tools for background checks, behavioral analytics and incident reporting to strengthen prevention programs. These technologies enhance detection and oversight but also introduce potential privacy and data-handling liabilities that carriers are beginning to monitor. Underwriters view proactive adoption of screening and monitoring systems as a positive risk indicator, provided they are properly managed.
Emerging risks
Contractual requirements for SAM coverage are expanding in the public sector, particularly in education and government-funded programs. This has led many organizations to the E&S market for solutions that satisfy specific limit and form requirements.
Strategic renewal approach
A successful renewal strategy in 2026 requires early, informed and strategic engagement. Insureds should begin the process well in advance, 90 to 120 days before expiration, to allow time for market exploration and underwriting discussions. Segregating SAM exposure from general liability or professional lines can improve placement outcomes by preventing one difficult exposure from influencing the rest of the program.
Documentation remains critical. Underwriters expect to see proof of strong risk management, including employee training programs, supervision standards and crisis response procedures. For insureds struggling with reduced capacity, creative program design is key. Layered structures, captives and self-insured retentions are becoming more common as buyers seek ways to fill coverage gaps and manage rising premiums.
London
The London and reinsurance markets remain cautious participants in the SAM space. Many markets have reduced or withdrawn support for full-limit SAM coverage, constraining capacity available to primary and excess carriers. For select insureds with clean loss histories and demonstrable controls, London can still offer follow-form or excess coverage, but appetite is highly selective. Underwriting remains data-driven, and placements typically require detailed submissions and evidence of rigorous prevention programs. Overall, London serves as a supplemental—not primary—option for organizations with strong risk management and complex coverage needs.
Be on the lookout
- As we continue to see an increase in contractual mandates requiring standalone SAM coverage for education, government and healthcare providers, working with a specialist broker that understands the limited SAM marketplace—and maintains established relationships with key underwriters—is essential for achieving the best possible outcome.
- In healthcare and social services, abuse coverage remains one of the most challenging lines to place, especially for operations involving children, transportation or residential care. The growth of self-insured retentions, captives and alternative risk structures could address shrinking commercial capacity.
Insight provided by:
- Seth Brickman, Managing Director, Business Risk Partners
- Joe Carlson, SVP, Amwins Brokerage
- Philip Carbone, EVP, Amwins Brokerage
- Kirsty Mitchell, Divisional Director, Amwins Global Risks
- April Salvas, Principal Underwriter, Business Risk Partners
![]()
Wildfire
The wildfire insurance market is showing cautious optimism. Despite continued construction in high-risk areas across the West, capacity and pricing have begun to stabilize. Accounts with moderate wildfire scores (below 75, particularly those under 60) are seeing more favorable terms and expanded underwriting appetite, while higher-risk properties remain challenged.
E&S carriers have loosened their guidelines, showing renewed openness to wildfire exposed risks and offering lower deductibles, while new and existing programs are helping fill coverage gaps. At the same time, stricter enforcement from Fannie Mae and Freddie Mac is pressuring HOAs to secure full wildfire limits, driving additional demand for capacity and reinforcing the market’s ongoing need for creative, flexible solutions.
Capacity and pricing
Capacity is expanding and pricing is easing across most areas, a trend expected to continue into 2026, barring any major catastrophic events. Carriers are taking on larger shares, with lines that once capped at $2.5M now reaching $5M, and $5M lines growing to $10M. For risks with moderate wildfire scores (typically between 40 and 60) and higher attachment points, some markets are even offering larger limits.
While there haven’t been major new entrants to the E&S market, several direct habitational programs, many originating in the East, are now expanding into western states. Though these programs still carry wildfire restrictions, they’re increasingly able to write risks that were once reserved for the E&S space, signaling a gradual broadening of options for wildfire-exposed properties.
Amwins has also found success leveraging parametric wildfire solutions to address the growing gap left by high deductibles on CA Fair Plan placements. As the Fair Plan begins quoting larger commercial risks, sometimes exceeding $100M in total values, insureds are often faced with substantial retentions that can strain their balance sheets.
Our parametric wildfire policies provide an innovative, data-driven way to offset these exposures by delivering rapid, transparent payouts triggered by measurable wildfire events, helping clients manage financial volatility and maintain resilience in challenging markets.
Coverage limitations
Wildfire deductibles are decreasing, with many accounts that previously carried $500,000 deductibles now seeing reductions to around $100,000, depending on exposure. Coverage terms are also broadening as E&S carriers continue to ease their guidelines and show more appetite for brush and wildfire-exposed risks, particularly those with RiskMeter wildfire scores below 50 and 60.
Retailers now have more direct solutions available as well. New wildfire programs are capturing a large share of the market and developing new products tailored to brush-exposed habitational risks, helping to expand options and improve affordability for insureds.
Market dynamics
Economic impact
Rising tariffs on materials such as lumber and furniture are expected to have an impact on rebuilding and replacement costs in the coming months, contributing to broader inflationary pressures across the property market. Lenders are pushing back on insureds who have the CA Fair Plan with a wrap, asking insureds to secure property terms up to the full limit, including wildfire, with more comprehensive coverage terms and sublimits.
Social inflation and regulatory challenges
Social inflation and third-party litigation funding continue to put pressure on insurers, particularly in California. With increased scrutiny from regulators and a difficult judicial climate, carriers operating in California face heightened compliance obligations and legal exposure.
Emerging risks
As more competitors enter the market chasing the same business, pricing pressure is building. The increase in available capacity and program options is fostering competition that may lead to further rate softening. While this benefits insureds in the short term, it could challenge long-term underwriting profitability if pricing fails to keep pace with evolving wildfire exposures and rising reinsurance costs.
London
The homeowners’ insurance market remains constrained when compared to pre-2022 levels, but signs of softening are emerging as new E&S capacity enters and some regional carriers selectively return to the space. Consumers are increasingly willing to accept coverage caps and exclusions to secure policies, and competition has grown for newer homes in lower-risk wildfire areas. However, older properties and those in high wildfire zones continue to face limited options.
Be on the lookout
- We are seeing premium increases for properties required to carry full limits. However, there are now more viable markets willing to cover smaller properties (like apartments, etc.) with wildfire scores below 50, as long as they fit within the criteria.
- The California FAIR Plan (CFP) excludes coverage for smoke damage, despite court rulings, claiming that the restrictive smoke damage policy violates state law because it provides less coverage than California's standard fire insurance policy requires. The CFP also currently requires homeowners to show a “distinct, demonstrable and physical alteration” to prove smoke damage. If this continues and the CFP is able to continue to deny coverage for smoke damage claims, there is a big gap in coverage: smoke damage is not covered by a WRAP policy as those policies exclude everything related to fire coverage, including smoke damage. The best solution is to find alternative coverage, outside of the CFP.
- Renee Belgarde, EVP, Amwins Brokerage
- AJ Conrad, SVP, Amwins Brokerage
- Mike Richardson, Director, Amwins Global Risks
![]()
MGA Marketplace
The MGA marketplace again outpaced overall property and casualty market growth in 2025. Estimated MGA premium written by U.S. insurance companies rose roughly 16% year-over-year, compared to a 10% increase in the broader P&C sector. This continued expansion reflects the MGA segment’s ability to adapt to changing conditions while leveraging talent, technology and capital to meet evolving client and carrier needs.
Capacity and pricing
What began as a period of accelerated growth several years ago has now matured into a more stable, data-driven marketplace defined by specialization and scale. Submission volumes remain high; however, stricter underwriting appetites and an emphasis on profitable growth have contributed to lower bind ratios across some lines.
As carriers increasingly lean on MGAs as an efficient path to deploy capacity and drive growth in a competitive environment, supply now exceeds demand in select areas. Programs are vying for both capacity and distribution in a crowded marketplace, creating downward pressure on rates.
Market dynamics
The MGA marketplace continues to attract capital. Reinsurers and markets in Bermuda and London (as well as alternative investment firms) are actively seeking exposure to MGA portfolios.
New incubators and platform solutions are also giving entrepreneurs greater optionality to launch MGAs, fueling market fragmentation even as consolidation accelerates. M&A activity remains robust, driven by strong valuations and a desire to scale. MGAs continue to seek access to additional data and technology infrastructure, while strengthening carrier relationships before the market potentially slows in 2026.
Technology & AI
Technology is a major driver of growth and sophistication in the MGA market. With digital infrastructure and comprehensive data capabilities now standard, MGAs must continually update their platforms and analytics to preserve both competitive advantage and carrier partnerships. These ongoing investments improve portfolio transparency and underwriting effectiveness, allowing MGAs to quickly meet carrier capacity requirements and introduce innovative products.
Carriers are also focusing on partnerships that demonstrate strong controls, stable loss ratios and proven portfolio management capabilities. MGAs that can pair underwriting expertise with robust data and technology infrastructure will be best positioned to thrive as the market transitions from rapid expansion to measured, performance-driven growth.
AI is increasingly being integrated into underwriting workflows. Used primarily to improve processing speed and support risk assessment, real-world AI-use cases are expected to expand over the next 12 months.
London
The London MGA market continues to attract significant attention from both traditional and alternative capital sources, with supply generally exceeding demand and exerting downward pressure on rates. Short-tail classes such as property and marine have seen reductions of roughly 10% to 15%, though pricing levels remain sufficient for carriers still seeking growth.
An abundance of capacity has encouraged carriers to expand their large portfolio underwriting strategies, often using dedicated risk selection teams to maintain disciplined approaches while pursuing gross written premium targets. The relatively stable loss experience in recent years, combined with limited major catastrophe activity, has supported this appetite. However, social inflation, rising repair costs and economic pressures present long-term challenges, particularly in casualty and professional lines. In response, many carriers are favoring short-tail business to limit volatility exposure and preserve profitability.
For MGAs operating in London, portfolio solutions that allow carriers to share in all in-scope risks have proven effective at smoothing results, improving efficiency and managing volatility across diverse books of business, while investments in technology and AI continue to accelerate underwriting decision-making and risk assessment.
Be on the lookout
- Despite softening conditions, the MGA marketplace remains one of the most active and innovative segments in insurance. Continued M&A activity, potential disruption in the fronting space and evolving AI applications will shape the year ahead.
- MGAs that combine strong data maturity, operational efficiency and disciplined underwriting will be best positioned to capture opportunity as the market continues to evolve.
- Amwins remains deeply engaged in the MGA space, deploying portfolio solutions that help smooth carrier results, enhance efficiency and deliver meaningful value across a diversified platform, reinforcing our role as a trusted partner in an increasingly complex and interconnected marketplace.
Insight provided by:
- Ryan Armijo, President, Amwins Group
- Mark Bernacki, Chief Underwriting Officer, Amwins Group
- Simon Jackson, Managing Director, Amwins Global Risks
![]()
Claims
The claims environment remains one of the most complex and consequential forces shaping the broader insurance market heading into 2026. Inflationary pressures—both economic and social—continue to elevate loss costs across nearly every line, while litigation funding and evolving jury dynamics are prolonging cases and expanding settlement values. Meanwhile, AI and other technological advancements continue to foster uncertainty and present new liabilities.
Capacity and pricing
As a defining force across all lines heading into 2026, the claims landscape continues to shape how carriers deploy capacity and price risk. Inflationary pressures (both social and legal) are driving upward momentum in settlement values and loss costs, creating ripple effects across the industry.
While nuclear and thermonuclear verdicts continue to capture attention, their broader impact lies in how they influence attritional claims. Even modest settlement increases on smaller claims are compounding into portfolio-level cost escalation far outpacing economic inflation. This trend has led to tighter underwriting standards and higher retentions in several classes, particularly in auto and general liability.
Capacity remains constrained in transportation and other high-severity lines, with several long-tenured carriers exiting the marketplace entirely. New entrants without legacy loss burdens are helping temper pricing in certain areas, but this has created a bifurcated marketplace where experienced carriers are forced to balance competitive pressure with sustained loss emergence.
Coverage limitations and underwriting
Efforts to control exposures have led insurers to focus on implementing proactive claims management strategies and refining policy wording. Some markets are even beginning to explore the impact of exclusions or sublimits tied to litigation funding, social inflation and evolving AI.
Underwriters are employing new tactics as well. By emphasizing risk selection and data-driven loss analytics, they’re hoping to better anticipate the severity and frequency of these trends. Ultimately, the downstream effect is a more cautious approach to renewals, with increased scrutiny on claims history, litigation posture and insureds’ safety programs.
Market dynamics
Regulatory & litigation trends
Legal and legislative environments continue to shape claim behavior across the U.S. Tort reform efforts are slowly gaining traction, though results remain uneven. Florida’s 2023 reforms have shown a measurable impact, with nuclear verdict frequency dropping significantly as the state moves from one of the most volatile jurisdictions to a more moderate position. Georgia, meanwhile, remains challenging despite new measures targeting litigation funding transparency.
Litigation funding remains a key driver of claim inflation. Third-party financiers are extending the life of claims, strengthening plaintiffs’ positions and increasing the settlement amounts needed to reach a resolution. At the federal level, proposed tax measures on litigation proceeds could alter the economics of this practice, though meaningful effects are unlikely within 2026.
At the verdict level, plaintiff strategies such as reptile theory and anchoring continue to sway juries, appealing to emotion and normalizing higher awards. Juror sentiment, undoubtedly, remains a significant factor in large-loss outcomes.
Technology & AI
Automation and AI are beginning to introduce new liability questions that blur traditional coverage lines. Autonomous driving systems, for instance, have prompted litigation that could spill across both product liability and construction exposures. As AI becomes embedded in decision-making systems and equipment, attribution of fault may increasingly involve both technology and human oversight, raising new questions for claims handling and defense.
Emerging risks
Outside of AI and litigation funding, the interplay between infrastructure, environmental accountability and digital reliance could spark additional claims trends over time. Additionally, increased juror desensitization to high payouts and ongoing social and political polarization add to the unpredictability within the claims landscape.
Strategic renewal approach
For 2026, a disciplined and data-informed renewal strategy will be critical to managing claim volatility. Retailers and insureds should:
- Engage early with underwriters to discuss claims trends and mitigation efforts.
- Highlight loss control, safety and litigation management improvements that demonstrate reduced exposure.
- Prepare for higher scrutiny around defense counsel selection, settlement strategy and historical claim outcomes.
- Leverage carrier partnerships to evaluate alternative dispute resolution or structured settlements where appropriate.
- Expect a continued emphasis on transparency in claims reporting and litigation engagement.
The ability to demonstrate proactive claims management and responsiveness to litigation trends will be a differentiator at renewal.
Be on the lookout
- Continued escalation of smaller, attritional claims driving overall inflation is probable throughout the coming months.
- Expansion of tort reform efforts is expected in 2026, beyond Florida and Georgia, as is increased regulatory scrutiny and taxation of litigation funding arrangements.
- Growing influence of plaintiff attorney advertising and AI-driven jury analytics will be a key factor in claims going forward.
Insight provided by:
- Jason Kunert, EVP and Amwins Head of Claims
![]()
Group Benefits
Reputable consulting firms are expecting median 2026 medical cost trend increases to range from 6% to 9%. Carriers are applying between 10% to 12% medical cost trend in formula renewals, with pricing models baking in buffers to offset volatility and high-cost claims. And with estimated increases of 11%, prescription drugs are driving the highest rise in costs for health plans.
Higher rates and plan expenses have spurred more inquiries about cost-containment strategies, value-based care models, single parent captives, Professional Employer Organizations (PEOs), level-funding and Individual Coverage Health Reimbursement Arrangements (ICHRAs). Fully-insured employers are increasingly open to high-deductible plans, self-funding and level-funding to dodge volatility and mitigate cost pressures. Captive solutions remain viable options in the small and large group markets.
Medical cost inflation (which typically outpaces overall inflation metrics) and a myriad of healthcare industry-specific factors are driving material market changes within a relatively short period. In 2020, medical inflation began to trail broader inflation metrics—an atypical phenomenon. However, medical inflation began to rise in 2024, catching up with broader inflationary trends.
Healthcare provider and workforce shortages, emerging high-cost specialty therapies, spikes in prescription drug use and variable administration costs are influencing the commercial market. The growing Medicare population is correlating to a greater dependence on commercial payers to help offset lower government reimbursements and profitability shortfalls. Any significant reduction in federal health care funding could further strain the commercial market. Evolving trade policy and tariff decisions may also affect the cost and availability of medical devices, supplies and pharmaceuticals.
Across the country, regional health system and network contract negotiations are becoming increasingly strained. Some have escalated into high-profile public disputes or even ended at an impass, causing significant disruption for brokers, plan sponsors and covered members.
Market dynamics
Health claims that traditionally fell below $100,000 are now topping the $250,000 mark with increasing frequency. This cost trend naturally translates to more high-dollar claims reaching stop loss thresholds and higher reported loss ratios. According to one stop loss carrier, $1M+ claims spiked by 61% between 2021 and 2024. Compounding the issue for employers, added scrutiny and slower claims payments are becoming more common, making short or limited run-in and run-out periods (such as three or six months) increasingly risky.
Infusions (often with wide cost variances based on the site of care), injections and specialty biologics are directly contributing to higher premiums. Spiking pharmacy costs can consume 30% (or more) of plan resources, leading to a push for price transparency, more aggressive negotiation of PBM contracts and inclusion of a variety of cost containment programs. More states may pursue legislation similar to California’s SB 41 to regulate PBMs, prevent inflated prescription drug prices and define the explicit fiduciary duty of PBMs to act in the best interests of their payer clients.
GLP-1 weight management drug claims, while not severe or catastrophic, are increasing in frequency and prevalence. Some employers are adding 2% or more to their budgets for GLP-1 drugs alone.
At the same time, gene, cell and CAR-T therapy claims—while life-changing and life-saving—are less frequent and far more severe, posing another financial challenge for plans. To date, the FDA has approved nearly 40 gene and cell therapies, and the pipeline of new, pending treatments is robust. Costs range dramatically, from $250,000 to $4.25M for the drug itself and administration adding anywhere from tens of thousands to more than $1M.
Novel therapies and brand-name pharmaceuticals can carry significant costs. However, biosimilar alternatives and generic drugs could reduce drug expenses by up to 80% and 95% respectively, compared to brand-name versions. Any prescription drug savings will certainly benefit commercial plans, but bringing biosimilars and generics to market takes years.
Regulatory & legislative trends
Regulatory uncertainty at the state and federal levels is contributing to more conservative underwriting. Many provisions of the 2017 Tax Cuts and Jobs Act (which includes the ESI Tax Exclusion) are set to expire at the end of 2025. The exclusion is estimated to cost the federal government more than $300B annually. However, replacing, modifying or limiting the credit may weaken the incentive for employers to offer coverage.
ACA-specific adjustments and the FDA’s stance on gene and cell innovation (no matter the administration) have potential to transform the commercial market. Under its current leadership, the FDA is exploring flexible trial designs and accelerated approval pathways to bring more novel and, oftentimes, more costly therapies to market faster.
Trends in the group health benefits market
Carriers are increasingly selective with risk pools, deploying tighter underwriting across the board. Extended sales cycles, greater scrutiny during renewals and continued consolidation of retail and medical administration compounds the pressure.
Benefits remain a competitive tool for employee recruitment and retention. As such, group health benefits are evolving from a physical health-only focus into total rewards packages with a whole-person view. Personalized packages can include expanded women’s health, fertility care, menopause support, mental health, digital health tools, as well as proactive, holistic wellness care to address burnout and chronic conditions. And we continue to see an increased demand for niche perks like pet insurance, financial wellness tools and student loan assistance.
The market is moving toward bundled and tech-enabled service delivery. Employers expect more integrated, intuitive experiences to include benefit administration, decision-making support, wellness solutions and ancillary lines. They desire simplified enrollment, actionable analytics and measurable ROI. We see a push for tech-driven claims processing and proactive employee engagement solutions.
Fully-insured market insights
The fully-insured market is yielding unprecedented and above-average increases, with major carriers citing significant losses, worsening risk pools and higher-than-expected utilization. Early 2026 filings show median ACA premium hikes in the 12% range. However, some cases are reporting increases between 20% and 25%. Rising premiums are especially challenging for individual renewals and small groups, with some employers planning to stop offering insurance due to overall unaffordability.
Enrollment losses have been more noticeable over the past six years. In some regions, ICHRAs are trending, but growth could slow if individual market costs climb. Fewer carrier options, rate volatility and product limitations are disrupting the small group segment.Be on the lookout
- Employers are actively seeking alternate cost-saving solutions. No solution is dismissed by clients and brokers, and alternative strategies and structures (including group and association-type products and captives) are all on the table for discussion.
- We plan to share additional details on fully-insured market trends by region in early 2026.
Self-funding insights
Approximately 67%* of U.S. workers are enrolled in a self-funded plan, and, despite a firming market, the self-funded space remains competitive. We are seeing a story of “haves” and “have-nots,” with more rate caps and higher decline rates for moderate to poor-performing groups versus fierce competition to capture and retain the best.
Self-funding and in particular, level-funding, continues to interest small and mid-market fully-insured groups, with recent growth trends particularly impacting groups up to 200 lives. Many inquiries are prompted by a reaction to unsustainable rate increases, but the allure of accessible data, transparent pricing and cost predictability achieved with self-funding is strong. Absent, incomplete or stale data available to fully-insured groups often complicates the stop loss quoting process, yet many are still making the transition to self-funding.
Stop loss market insights
The stop loss market (currently estimated at $40B) has seen a 250% increase in premium since 2016. Despite a 12-point erosion in loss ratio from 2014 to 2024, the stop loss market grew by 12.5% in 2024. Almost 93% of self-funded groups covering 200 to 4,999 lives and 66% covering 5,000 lives or more secured stop loss insurance in 2025.*
Stop loss renewals have seen an uptick to leveraged trend levels or higher, along with underwriters seeking risk mitigation through lasers and other contractual changes. Rate cap increases and lasered options are more common than in years past, with underperforming risks seeing “max increase” renewals, hitting their rate cap at or around 50%.
In contrast, competition for the best risks with a profitable history and favorable outlook is fierce, yielding no change or even rates below current. New entrants have also contributed to competition for business, with the additional supply countering the increases sought from the market.Be on the lookout
- The stop loss market will continue to tighten as carriers navigate profitability pressures.
- Many self-funded employers are not experiencing the cost-savings expected from PPO networks. This has led to more scrutiny and heightened interest in price transparency, claims data, discount calculation strategies and network value.
- Groups are leaning heavily on TPAs and tech-forward vendor partners to deliver actionable insights and creative plan structures.
- Plans seeking to combat rising costs continue to be drawn to steerage strategies, cost-containment solutions such as dialysis and infusion programs, network creativity and custom medical and prescription drug administration to maintain robust coverage while controlling plan risk and rates.
Small group market insights
The small group market should expect volatility in 2026. Rising premiums, reduced product differentiation and limited underwriting flexibility will push more small employers to explore alternative funding. TPAs are trying to go up-market (limiting to groups with 250 or 500+), but the 100 to 250 market is desperate for an unbundled option.
AI and risk data census underwriting in the small employer market is gaining popularity. Front-runners in the AI-quoting space are significantly improving turnaround times and close ratios, and brokers are growing more comfortable using AI to drive efficiency.
Ancillary market insights
The ancillary market is entering a new phase of transformation, expansion and consolidation. Employers are incorporating specific benefits and voluntary add-ons to differentiate offerings without spiking core plan costs. We are seeing a stronger emphasis on service depth, cross-line integration and relationship-based selling to transition entire books rather than individual cases.
Well-recognized carriers and tech-enabled players are expanding their digital engagement tools to capture and convert business more effectively, and the evolution of state‑mandated leave may reshape the group disability market.
Be on the lookout
- Brokers have an emerging opportunity to gain scale in the group disability market. At this time, active Paid Family Medical Leave (PFML) and Temporary Disability Insurance (TDI) programs are in place within 13 states and Washington D.C., with seven additional states pursuing legislation. More than 60% of major employers already offer voluntary leave programs, but emerging state-mandated regulations (and compliance requirements) will complicate processes, especially for large, multi-state employers.
- Navigating group disability coverage is challenging but also a real-time opportunity to expand premium volume and build recurring revenue. The statutory and private markets (valued between $15B and $20B) are projected to grow by almost 8% over the next two years, with advisory and placement revenue increasing by up to 10% annually. Agencies should seek partners with statutory expertise, integrated data‑driven insights and alliances with carriers and leave administration vendors to capture outsized growth.
Contributors
- Wright Dickinson, President, Amwins Accident & Health Underwriters / Beacon Risk Strategies
- Riva Dumeny, President, Amwins Group Benefits
- Jeremy Fife, CEO, Stealth Partner Group
- Bryan Herman, CEO, Nelligan
- John Hodson, President, True Benefit
- Anna Leifeld, Regional President, Stealth Partner Group
- Jack Lyons, SVP, Amwins Connect
- Mona Mehta, VP, Amwins Connect
- John Robinson, VP, Amwins Group Benefits
- Michael Monnich, Regional President, Stealth Partner Group
- Vicki Schmelzer, President, Amwins Accident & Health Underwriters
- Kevin Timone, EVP, Amwins Connect
* Kaiser Family Foundation. 2025 Employer Health Benefits Survey.